Extracting insights from IoT data using the warm path data flow
This blog continues our coverage of the solution guide published by Microsoft’s Industry Experiences team. The guide includes the following components:
- Ingesting data
- Hot path processing
- Cold path processing
- Analytics clients
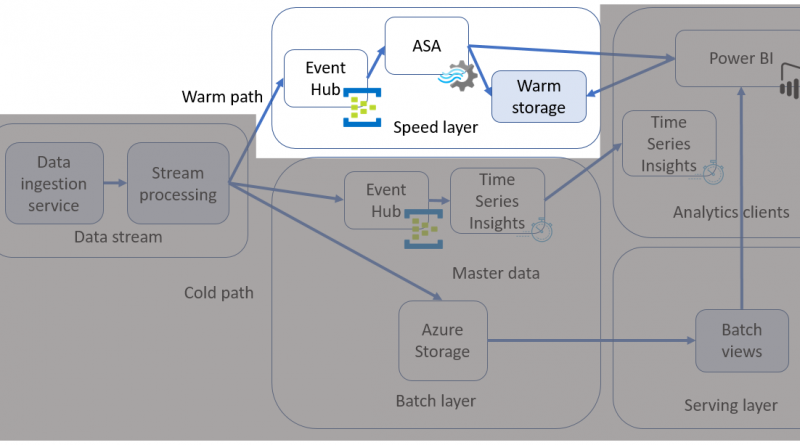
We already covered the recommendation for processing data for an IoT application in the solution guide and suggested using Lambda architecture for data flow. To reiterate the data paths:
- A batch layer (cold path) stores all incoming data in its raw form and performs batch processing on the data. The result of this processing is stored as a batch view. It is a slow-processing pipeline, executing complex analysis, combining data from multiple sources over a longer period (such as hours or days), and generating new information such as reports, and machine learning models, etc.
- A speed layer and a serving layer (warm path) analyze data in real time. This layer is designed for low latency, at the expense of accuracy. It is a faster-processing pipeline that archives and displays incoming messages, and analyzes these records, generating short-term critical information and actions such as alarms.
This blog post covers the warm path processing components of the solution guide.

Azure Event Hubs is a big data streaming platform and event ingestion service and is a great option for ingesting the data from the data stream. This article explores relevant Azure native services. However, if you prefer to use Apache Software Foundation’s tools and technologies, Event Hubs also supports Apache Kafka MirrorMaker, Apache Flink, and Kafka Streams in the Apache Kafka ecosystems.
Using Event Hubs in a scalable way is important as the volume of data streamed through them increases. Please review documents on the Event Hubs features and the programming guide for the partition and consumer groups concepts. Choosing the best combination of the partitions and consumer groups depends on the nature of the data and how you want to process it. Aggregate numbers of partitions on an Event Hub should be consistent with the throughput units (TU) — please read the frequently asked questions for details. You can scale the ingestion of the messages on one Event Hub by using partitions. If the default maximum is not enough, you can submit a support request to increase the maximum. Another option is to use multiple Event Hubs to send different message types to separate hubs for a fan-out solution, depending on your scenario.
You can fan out the processing of the incoming data stream using consumer groups on the Event Hub, and compose complex processing topologies as your business requirements demand, as shown in the following figure.

Azure Stream Analytics (ASA) is an event-processing engine that enables you to examine high volumes of data streaming from devices. It can accept data from Event Hub, IoT Hub, or Blob Storage. You can use other stream processing frameworks such as Apache Flink for processing the incoming data stream. Please see this tutorial on how to use Apache Flink with Event Hubs for Apache Kafka.
Let’s assume we want to stream the changes on the temperature of a rotary component on a machine. We can write a query as follows to get the average over every five seconds using a tumbling window.
SELECT  System.TimeStamp AS WindowTime, DeviceName, ComponentName, avg(cast(SampleValue as float)) AS Average
FROM s2tempsamples timestamp by SampleTimestamp
WHERE SampleName = 'S2temp' AND TRY_CAST(SampleValue AS float) IS NOT NULL   AND DeviceName = 'Machine1'
GROUP BY SampleTimestamp, DeviceName, ComponentName, tumblingwindow(second, 5)
ASA provides four kinds of temporal windows to choose from: Tumbling, Hopping, Sliding, and Session. The following diagrams describe these window functions in order, and more information is available in the documentation.
A recent feature of ASA is the AnomalyDetection operator. It is used to detect three different types of anomalies:
- Bi-directional Level Change. A sustained increase or decrease in the level of values, both upward and downward. This value is different from spikes and dips, which are instantaneous or short-lived changes.
- Slow Positive Trend. A slow increase in the trend over time.
- Slow Negative Trend. A slow decrease in the trend over time.
If we are interested in detecting gradual increases, or bi-directional changes of the temperature on the rotary component, the sample query in the documentation can be modified to analyze the incoming stream as follows:
WITH AggregationStep AS
     (
          SELECT System.Timestamp as tumblingWindowEnd, AVG(SampleValue) as avgValue
          FROM s2tempsamples timestamp by SampleTimestamp
          WHERE SampleName = 'S2temp'
AND TRY_CAST(SampleValue AS float) IS NOT NULL
AND DeviceName = 'Machine01'
          GROUP BY TumblingWindow(second, 5)
     ),

    FillInMissingValuesStep AS
     (
           SELECT System.Timestamp AS hoppingWindowEnd,
                 TopOne() OVER (ORDER BY tumblingWindowEnd DESC) AS lastEvent
          FROM AggregationStep
          GROUP BY HOPPINGWINDOW(second, 300, 5)
     ),

    AnomalyDetectionStep AS
     (
           SELECT
                 hoppingWindowEnd,
                 lastEvent.tumblingWindowEnd as lastTumblingWindowEnd,
                 lastEvent.avgValue as lastEventAvgValue,
                 system.timestamp as anomalyDetectionStepTimestamp,
                 ANOMALYDETECTION(lastEvent.avgValue) OVER (LIMIT DURATION(hour, 1)) as
                 scores
           FROM FillInMissingValuesStep
     )

    SELECT
           alert = 1,
           hoppingWindowEnd,
           lastTumblingWindowEnd,
           lastEventAvgValue,
           anomalyDetectionStepTimestamp,
           scores
     INTO output
     FROM AnomalyDetectionStep
     WHERE
         CAST(GetRecordPropertyValue(scores, 'BiLevelChangeScore') as float) >= 3.25
        OR CAST(GetRecordPropertyValue(scores, 'SlowNegTrendScore') as float) >=
        3.25
The query output can be directed to various outputs with an “INTO” clause in the query. You can find the currently available output types in this document. One of the output types is Power BI that allows (near) real-time visualization options. The ASA job can also be directed to a data store, such as Azure Cosmos DB, or Azure SQL Database.
You may notice our recurring theme in this post from the previous ones. Analyzing IoT data is very context-dependent. Taking “utilization” as an example, determining the time a machine is producing parts depends on how your shifts are organized, the type of part you are manufacturing, and the machines you are using, in addition to technical components such as the communication protocol the machine is supporting and its configurations.
This blog has presented technology options on Azure for processing an incoming data stream but offers just examples. The actual solution architecture and implementation depend on your business needs and context.
Next steps
- Complete this tutorial if you want to use Apache Flink with Event Hubs for Apache Kafka.
- Complete the Power BI and Stream Analytics tutorial.
- Get the larger picture for extracting insights from IoT data from the solution guide.
Source: IoT