Monitor Azure services and applications using Grafana
Today, we are excited to introduce the Grafana plugin for Azure Monitor and Application Insights. Azure is an open platform that enables you to bring workloads built using your favorite tools and frameworks, and host them alongside a wide variety of services in Azure. As you continue your journey to the cloud, onboarding your applications to Azure, many of you expressed the need to leverage your existing open source devops and management tools for business continuity. Our mission is to meet you where you are and enable you to seamlessly leverage these tools in Azure. One popular tool is Grafana, a leading open source software to visualize your time series metrics. Several of you provided feedback on the ability to consume metrics from Azure services and applications in Grafana, which is part of your existing monitoring investments. We have some great news – you can now use the Grafana data source plugin for Azure to do this.
Grafana plugin for Azure Monitor and Application Insights preview
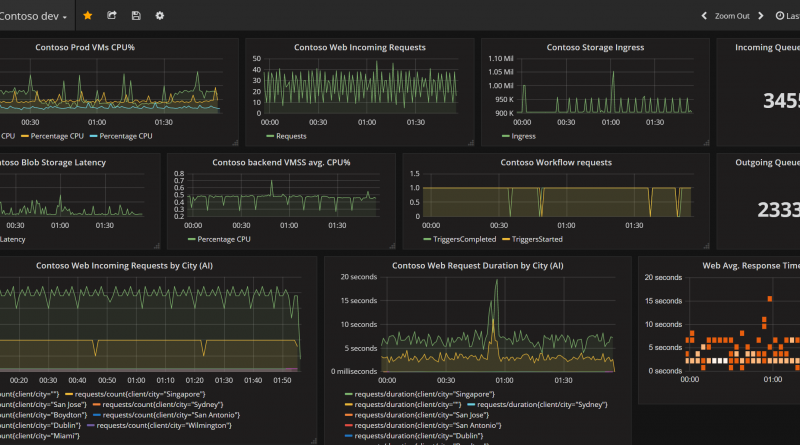
If you are already using Grafana, you can now use it to monitor Azure services and applications too, thanks to the new Azure Monitor data source plugin, built by the team at Grafana Labs, the company behind Grafana. This plugin, currently available in preview, enables you to all include metrics from Azure Monitor and Application Insights in your Grafana dashboards. Please visit the data source plugin installation page to review the setup instructions.
Figure 1: A Grafana dashboard that shows metrics from Azure Monitor and Application Insights
With this plugin, you can now bring together all the metrics collected from a variety of open source agents such as Collectd, Telegraf, and Prometheus, and metrics from Azure platform and applications into one dashboard.
Easy Grafana setup via Azure Marketplace offering
The team at Grafana Labs wanted to make this easier for you to get started with Grafana on Azure and therefore built an Azure Marketplace offer. You can leverage the Grafana server in Azure Marketplace, which is essentially a VM with pre-installed Grafana dashboard server and the Azure plugin.
A sample walkthrough to setup a Grafana dashboard with Azure Monitor and Application Insights metrics can be found in the Azure Monitor Documentation.
The team at Grafana Labs is excited to hear from you on the plugin and the Marketplace offer. You can reach out to them via on Twitter @grafana or submit your feedback in GitHub.
Wrapping up
We will continue to empower you to do more by innovating our platform and services, as well as integrating them with open source framework and tools you love by partnering with the community. The Grafana integration is just one of the many integrations yet to come. We are excited to hear your feedback after you try this on your applications and resources in Azure.
Source: Azure Blog Feed

