Unlock Query Performance with SQL Data Warehouse using Graphical Execution Plans
The Graphical Execution Plan feature within SQL Server Management Studio (SSMS) is now supported for SQL Data Warehouse (SQL DW)! With a click of a button, you can create a graphical representation of a distributed query plan for SQL DW.
Before this enhancement, query troubleshooting for SQL DW was often a tedious process, which required you to run the EXPLAIN command. SQL DW customers can now seamlessly and visually debug query plans to identify performance bottlenecks directly within the SSMS window. This experience extends the query troubleshooting experience by displaying costly data movement operations which are the most common reasons for slow distributed query plans. Below is a simple example of troubleshooting a distributed query plan with SQL DW leveraging the Graphical Execution Plan.
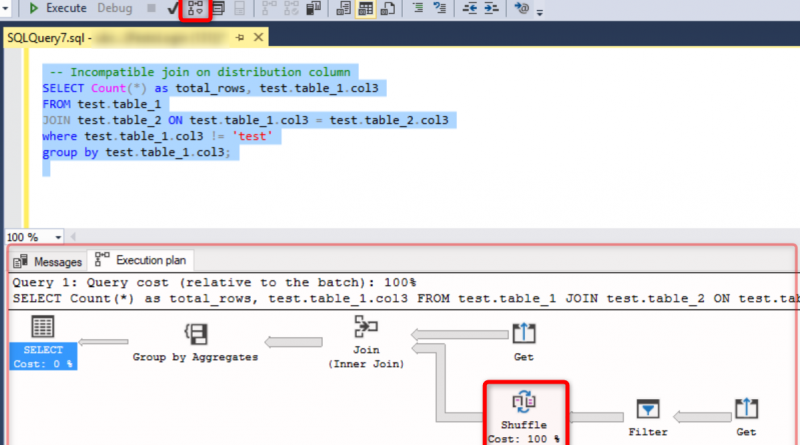
The view below displays the estimated execution plan for a query. As we can see, this is an incompatible join which occurs when there is a join between two tables distributed on different columns. An incompatible join will create a ShuffleMove operation, where temp tables will be created on every distribution to satisfy the join locally before streaming the results back to the user. The ShuffleMove has become a performance bottleneck for this query:
Taking a closer look at our table definition, we can see that the two tables being joined are distributed on different columns:
By leveraging the estimated Graphical Execution Plan, we have identified that we can improve the performance of this query by redistributing the table on the appropriate column to remove the ShuffleMove operation.
Troubleshooting and tuning distributed SQL queries just got easier. Download the latest SSMS release to start using this feature today! If you need help for a POC, contact us directly. Stay up-to-date on the latest Azure SQL DW news and features by following us on Twitter @AzureSQLDW
Source: Azure Blog Feed


