Monitoring Azure Kubernetes Service (AKS) with Azure Monitor container health (preview)
Monitoring the health and performance of your Azure Kubernetes Service (AKS) cluster is important to ensure that your applications are up and running as expected. If you run applications on other Azure infrastructure, such as Virtual Machines, you have come to rely on Azure Monitor to provide near real-time, granular monitoring data. We are happy to announce that you can now rely on Azure Monitor to also track the health and performance of your AKS cluster. Let’s look at the new container health monitoring capability in Azure Monitor.
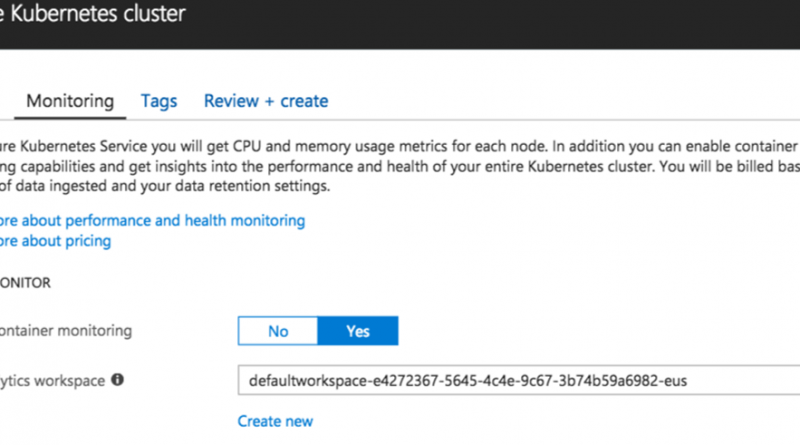
You can enable container monitoring from the Azure portal when you create an AKS cluster. You may notice the prompt for a Log Analytics workspace, and the reason for this will become clear throughout this post. For now, just know that you are providing a central location to store your container logs.
Now that you have gone through the wizard and setup AKS cluster with container health, let’s go through an example to see how you would use it. Start by clicking on Health in AKS. Let’s say, you believe there is a possible resource bottleneck somewhere in your Kubernetes cluster. Since you aren’t sure exactly what and where the issue is, you can start with the Nodes view. Pick the right node and look at the memory usage (you may choose the residual or working set memory). You can keep drilling down to the pod and to the container.
Next, you may select controllers or containers from the top of the page and review the status and resource utilization for those objects. Looking through the views, it is clear that there are two problems. First, the nodes in general are running a lot of containers. You may want to re-allocate your containers at some point.

However, the more important and immediate problem is memory usage of the containers- especially the “adminconsole” container which is at 85 percent memory usage.

You can spin up new containers to get around this issue, but you may want to dig deeper and find out the root cause for the high memory usage. Container Health can help with that investigation. Click on view logs and you will see all the Log Analytics workspace with all the log data from your container.

Now you see why configuring the Log Analytics workspace was important! In addition to storing the data, Log Analytics gives you out of the box insights, and the ability to run advanced queries to help you get to the bottom of the issue.

We hope you liked this brief overview on container health monitoring with Azure Monitor for AKS. In case you aren’t using AKS yet, but still deploy containers on Azure, look at our container monitoring solution. We are still in early stages with this public preview and have a lot of exciting features in store. We would love to hear your feedback and suggestions as we work towards our goal to ensure you have your AKS cluster health information available at your fingertips. You can learn more about container health by visiting our documentation.
Source: Azure Blog Feed


