Extract management insights from SQL Data Warehouse with SQL Operations Studio
SQL Operations Studio can be leveraged with Azure SQL Data Warehouse (SQL DW) to create rich customizable dashboard widgets surfacing insights to your data warehouse. This unlocks key scenarios around managing and tuning your data warehouse to ensure it is optimized for consistent performance. Previously, developers had to manually and continuously execute complex DMV queries to extract insights from their data warehouse. This leads to a repetitious process when following development and tuning best practices with SQL DW. Now with SQL Operations Studio, customized insight widgets can be embedded directly within the query tool enabling you to seamlessly monitor and troubleshoot issues with your data warehouse.
The following widgets can be generated by using the provided T-SQL monitoring scripts within SQL Operations Studio for common data warehouse insights.
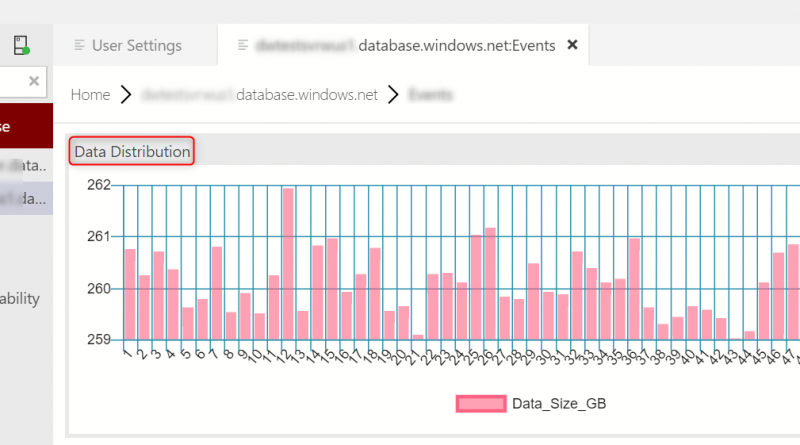
Data Skew
Detect data skew across distributions to help identify and troubleshoot query performance issues:
Columnstore health and statistics
Leverage views to help maximize columnstore row group quality and ensure table statistics are up to date for optimal query performance:
User Activity
Identify and understand workload patterns through active sessions queries, queued queries, loads, and backups:
Resource Bottlenecks
Ensure adequate resources are allocated such as memory and TempDB:
Next Steps
There are countless custom insight widgets that could be written for SQL DW through T-SQL scripts. Download and contribute scripts to the SQL Data Warehouse samples Github and install the latest version of SQL Operations Studio to get started.
Source: Azure Blog Feed


