Traffic Analytics now generally available
We are excited to announce the general availability (GA) of the Traffic Analytics, a SaaS solution that provides visibility into user and application traffic on your cloud networks.
Since the public preview, three months ago, the solution has analyzed several terabytes of Flow logs on a regular basis for network activity across virtual subnets, VNets, Azure data center regions and VPNs, and provided actionable insights that helped our customers:
- Audit their networks and root out shadow-IT and non-compliant workloads.
- Optimize the placement of their workloads and improve the user experience for their end users.
- Detect security issues and improve application and data security.
- Reduce costs and right size their deployments by eliminating the issue of over-provisioning or under-utilization.
- Gain visibility into their public cloud networks spanning multiple Azure regions across numerous subscriptions.
This GA release includes enhancements that help you detect issues and secure/optimize your network, faster and more intuitively than before.
Some of the enhancements in this release are:
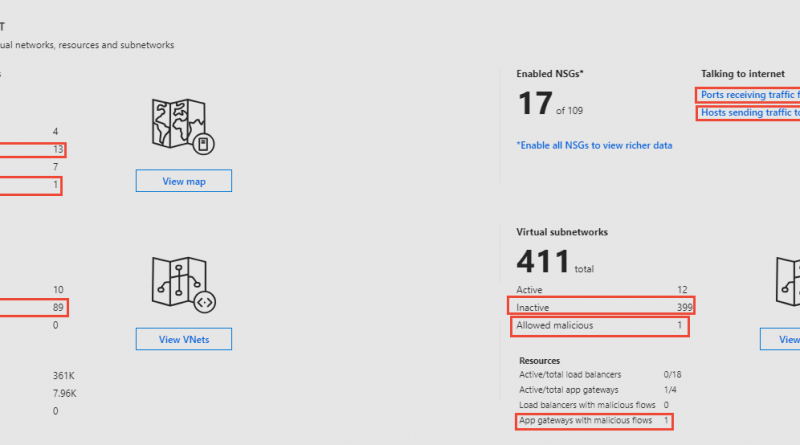
- Your environment: Provides a view into your entire Azure network, identifies inactive regions, virtual networks, and subnets – for example, network locations with VMs and no network activity for further analysis. Detects malicious flows as they flow across application gateways, subnets, and networks. Indicate open ports conversing over the Internet and hosts sending traffic to the Internet to qualify possible threats.
Figure 1: Your environment provides an overview of your cloud network with drill-down into regions, VNets, and subnets with intuitive and visually rich network maps.
- Summary view: Provides a summary of allowed, blocked, benign, and malicious flows across inbound and outbound traffic. Unusual increase in traffic types merit forensic investigations, such as higher number of allowed malicious flows and higher number of benign blocked flows.
Figure 2: Traffic Summary highlights the allowed malicious flows and large number of benign, but blocked, flows.
- Application activity: Identify workload activity including applications generating or consuming the most flows and the top VM conversation pairs at granularities ranging from VNets to hosts. Secure your network using insights from malicious and blocked traffic by the application/port, or update your network security groups (NSG) to allow normal traffic. For example, identify which ports are open for communication and allowing malicious flows. These merit further investigation and possible update in NSG configuration.
Figure 3: Traffic flow distribution at host, subnet, and VNet granularity.
Figure 4: Flow by port determines the top applications on the network and the top consumers.
- Capacity planning: VPNs constitute an important medium for hybrid and inter-VNet connectivity. View utilization across your gateways, and detect under-utilized or maxed-out gateways. Use the list of top VPN connections per gateway to understand your traffic patterns, distribute traffic load, and eliminate downtime due to under provisioning.
Figure 5: Capacity utilization of VPN gateways.
- Application Gateway and Load Balancer support: Traffic Analytics now extends its analytics capabilities to include traffic flowing through Azure Application Gateways and Load Balancers. Get insights on traffic pattern, resources impacted by malicious traffic, and traffic distribution to backend pool instances and hosts.
Figure 6: Flow statistics for Application Gateways and Load Balancers.
- Secure your cloud network with NSG insights: Gain detailed statistics ranging from the top five NSGs and NSG rules to detailed flow information, allowing you to answer the questions, “How effective are your NSGs?”, “What are the top rules per NSG?”, “Are they allowing traffic from malicious sources?”, “What are the flow statistics per NSG?”, “What are the top talking pairs per NSG?”, and more.
Figure 7: Detailed statistics on NSGs and time series charts.
- Automate your deployment: Have several NSGs across regions that need to be enabled for analysis? Traffic Analytics now supports PowerShell (v6.2.1 and higher) to get you up and analyzing in minutes. To learn more, check out our documentation.
- More regions: You can now add a workspace in South East Asia and/or analyze NSGs in this Azure region. Check out the FAQ for the complete list of supported regions.
Get started
To get started, see the detailed instructions on how to setup Traffic Analytics.
We are listening!
Thank you for trying out Traffic Analytics and providing feedback. Continue to send us your suggestions via the UserVoice page.
Have a question?
Check out the Traffic Analytics FAQ.
Source: Azure Blog Feed


