Network Performance Monitor’s Service Connectivity Monitor is now generally available
Network Performance Monitor’s (NPM) Service Connectivity Monitor, previously in preview as Service Endpoint Monitor, is making general availability sporting a new name. With Service Connectivity Monitor, you can now monitor connectivity to services such as applications, URIs, VMs, and network devices, as well as determine what infrastructure is in the path and where network bottlenecks are occurring.
As services and users are becoming more dispersed across clouds, branch offices, and remote geographies, it is becoming more difficult to determine the cause of a service outage or performance degradation. These can be due to an issue with the application, stack, or cluster as well as network issues in the cloud, the carrier network, or in the first-mile. Service Connectivity Monitor integrates the monitoring and visualization of the performance of your internally hosted and cloud services with the end-to-end network performance. You can create connectivity tests from key points in your network to your services and identify whether the problem is due to the network or the application. With the network topology map, you can locate the links and interfaces experiencing high loss and latencies, helping you identify external and internal troublesome network segments.
Determine if it’s an application or a network problem
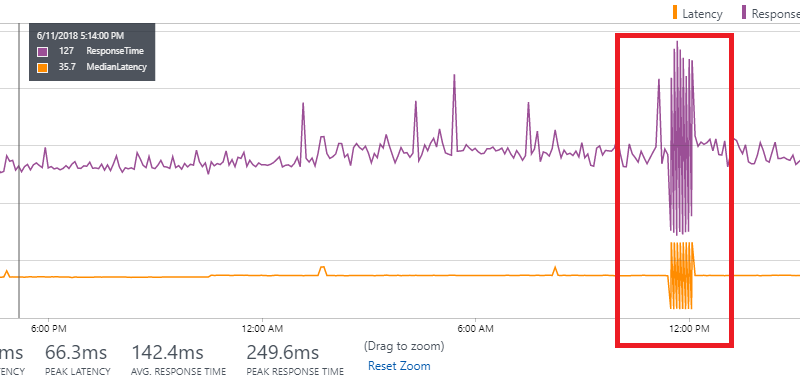
You can determine whether the application connectivity issue is due to the application or the network by corelating the application response time with the network latency.
The example image below illustrates a scenario where spikes in the application response time are accompanied with corresponding spikes in the network latency. This suggests that the application degradation is due to an increase in network latency, and therefore, the issue is due to the underlying network, and not the application.
The example snippet below demonstrates another scenario where there is a spike in the application response time whereas the network latency is consistent. This suggests that the network was in a steady state, when the performance degradation was observed. Therefore, the problem is due to an issue at the application end.
Identify network bottlenecks
You can view all the paths and interfaces between your corporate premises and application endpoint on NPM’s interactive topology map. You not only get end-to-end network visibility from your nodes to the application, but you can also view the latency contributed by each interface to help you identify the troublesome network segment. The image below illustrates a scenario where you can identify the highlighted network interface as the one causing most latency.
Monitor service connectivity from multiple vantage points from a central view
You can monitor connectivity to your services from your branch offices, datacenters, office sites, cloud infrastructure, etc. from a central view. By installing the NPM agents at the vantage points in your corporate perimeter, you can get the performance visibility from where your users are accessing the application.
The below example image illustrates a scenario where you can get the network topology from multiple source nodes to www.msn.com in a single pane of view and identify the nodes with connectivity issues from the unhealthy paths in red.
Monitor end-to-end connectivity to services
Monitor the total response time, network latency, and packet loss between the source nodes in your corporate perimeter and the services you use, such as websites, SaaS, PaaS, Azure services, file servers, SQL servers, among others. You can setup alerts to get proactively notified whenever the response time, loss, or latency from any of your branch offices crosses the threshold. In addition to viewing the near real-time values and historical trends of the performance data, you can use the network state recorder to go back in time to view a particular network state in order to investigate the difficult-to-catch transient issues.
Monitor connectivity to Microsoft services using built-in tests for Microsoft Office 365 and Dynamics 365
Service Connectivity Monitor provides built-in tests that allow a simple one-click setup experience to monitor connectivity to Microsoft’s Office 365 and Dynamics 365 services, without any pre-configuration. Since the capability maintains a list of endpoints associated with these services, you do not have to enter the various endpoints associated with each service.
Create custom queries and views
All data that is exposed graphically through NPM’s UI are also available natively in Log Analytics search. You can perform interactive analysis of data in the repository, correlate data from different sources, create custom alerts and views, and export the data to Excel, PowerBI, or a shareable link.
Get started
You can find detailed instructions about how to setup Service Conectivity Monitor in NPM and learn more about the other capabilities in NPM.
Provide feedback
There are a few different routes to give feedback:
- UserVoice: Post new ideas for Network Performance Monitor on our UserVoice page.
- Join our cohort: We’re always interested in having new customers join our cohorts to get early access to new features and help us improve NPM going forward. If you are interested in joining our cohorts, simply fill out this quick survey.
Source: Azure Blog Feed


