Azure #CosmosDB reference solution: Visualizing real-time data analysis with change feed
This blog post was co-authored by Devki Trivedi, Serena Davis, and Pascal Habineza.
The Cosmos DB Explorer Interns are excited to release a reference solution that utilizes the Azure Cosmos DB Change Feed feature (+ Azure Functions, Azure Event Hubs, Azure Stream Analytics, Power BI). This solution features a hands-on lab that guides users through the entire pipeline: from uploading data onto Cosmos DB to implementing a Change Feed trigger to visualizing that data in a meaningful way on Power BI.
With this reference solution, businesses can:
- Track sales and site activity in real time
- Manipulate data to see only the metrics useful to them
- Choose specific time windows for data to be processed
The Cosmos DB Change Feed provides an automatic mechanism for getting a continuous and incremental feed of modified or inserted records from Cosmos DB. A few of its most popular use cases include:
- Triggering microservices and functions within an event-driven architecture
- Replicating data to secondary data stores
- Real-time data processing
This reference solution focuses on real-time data processing, specifically to fit the needs of e-commerce companies. For example, while an e-commerce company may currently track the most popular products purchased, it may want to improve its advertising and pricing strategies by identifying products that are commonly being viewed and added to customers’ carts, but never purchased. The business may want to know its hourly, daily, and weekly revenue. Such metrics can help the business develop its advertising, inventory investment, and user experience strategies. Using this solution, businesses can customize these metrics to meet their needs and can observe them in real time using the Change Feed.
This reference solution models the above activities for interactivity and explains the process of deploying Azure resources. While it focuses on real-time data processing within the context of e-commerce, it remains applicable to many different domains.
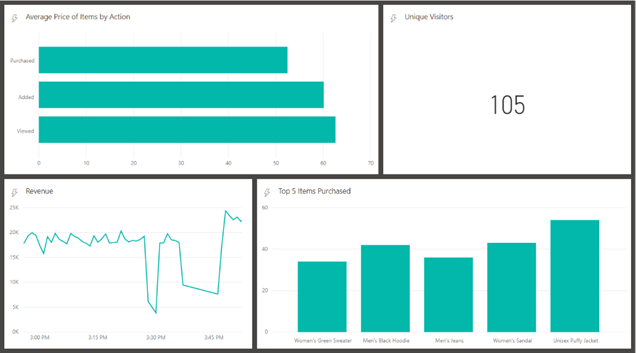
The result of this solution deployment is a dashboard as pictured below that updates in real time. Users can analyze business performance using metrics customizable to their requirements on the dashboard.

The pipeline below illustrates how the solution processes shoppers’ data from data generation to real-time data visualization with Power BI – all using Microsoft Azure!
 As data is created by online shoppers, it is processed and written to Cosmos DB. These data events are stored for future use. As this is happening, the Change Feed begins to takes over. For every instance of interaction, when a new event is created and pushed into Cosmos DB, the Change Feed adds that event to its records. Whenever the Change Feed adds an event, it triggers an Azure Function. The function iterates through each inserted document and sends it into the Azure Event Hub through an Event Hub client. Next, Azure Stream Analytics is responsible for building meaningful metrics by querying the data from Event Hub and sending the results to Power BI for user visualization.
Watch Visualizing Real-Time Data Analysis with Cosmos DB Change Feed and check out our change feed lab to learn how your business can build an application to extract insightful metrics from your data in real time.
Thoughts? Please send us your feedback.
Source: Azure Blog Feed

