Application Gateway Analytics via GoAccess
Azure Application Gateway provides an access log for customers that records traffic patterns and useful information, such as caller’s IP, requested URL, return code, and more. These logs can be pushed to Azure Storage and parsed with different tools for analysis such as Azure Log Analytics, Excel, and Power BI. The level of difficulty in setting up and using these mechanisms largely depends on customers’ familiarity and preferences.
Customers need traffic analytics for a variety of scenarios, some of which are:
- Live monitoring during an anticipated high traffic event such as a promotional campaign.
- Debugging and troubleshooting operational issues, including security incidents.
- Understand who their customers are based on observed traffic (client stats).
- Understand which parts or URLs of their application are in high demand (top requested URLs).
- Understand how well their application is performing (failures and latency).
We are pleased to add to the existing Application Gateway traffic analytics toolkit the integration of Application Gateway access logs with the popular open source GoAccess real-time log analyzer framework via a published Azure Quickstart template. This integration gives customers another choice for deriving insights on AppGW traffic flow. GoAccess presents data in a rich dashboard for multiple output formats such as terminal or HTML.
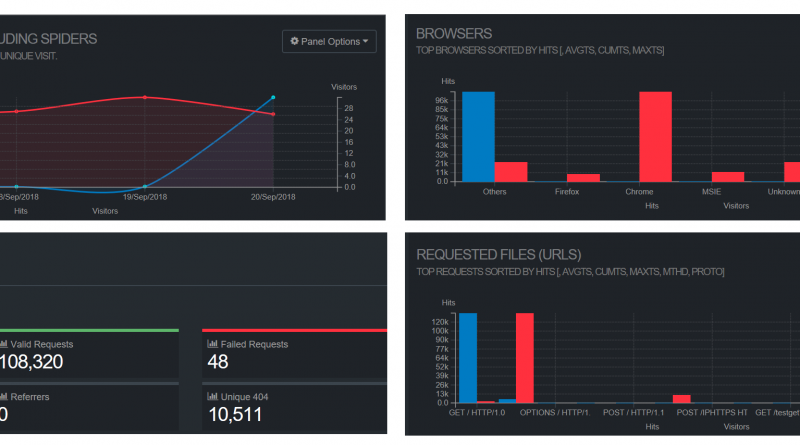
The tool provides valuable HTTP traffic statistics for your application gateways, including:
- Overall traffic stats like total requests, successful requests, failed requests, and unique visitor count.
- Top Unique visitors per day.
- HTTP Status codes distribution.
- Top Requested Files/URLs, 404 URLs.
- Client stats: Visitor Hostnames/IPs, Client Operating Systems, Browsers.
- Time distribution of traffic volume.
Some screenshots are below:
GoAccess is also efficient and lightweight in terms of resources needed to run.
Now let’s look at what happens behind the scenes. Our Azure Quickstart template for the GoAccess integration does the following when deployed:
- Creates and runs a Linux VM under your subscription.
- Installs and runs GoAccess and a webserver.
- Installs and runs an Azure connector that fetches access logs from your configured storage account in an incremental fashion.
The template requires few values as input from the customer when deployed, these are documented in the Readme file under the template. Once the deployment finishes, all you need to do as a customer is to point your browser at the URL http://<Public-DnsNameOfVM>/report.html, where <Public-DnsNameOfVM> is the DNS name you provided as one of the inputs for the VM installed by the template.
The setup is illustrated below:
What’s the catch? Not much, except for a couple of notes:
- There may be up to 5 minutes delay in the refresh of the statistics displayed, beyond the normal latency for logs streaming into your storage account. Once logs hit your storage account, GoAccess may take up to 5 minutes to refresh the data.
- The solution runs a VM under the customer subscription and as such you as the customer would be responsible for the VM and bandwidth costs that may be generated.
We hope our customers will take advantage of this Quickstart template for Application Gateway Analytics. For more details on the template as well as support options, please see the Readme.
As always, we welcome customer feedback via the Azure Feedback channel. Please continue to vote for features you want to see prioritized in our backlog.
Source: Azure Blog Feed


