Analysis of network connection data with Azure Monitor for virtual machines
Azure Monitor for virtual machines (VMs) collects network connection data that you can use to analyze the dependencies and network traffic of your VMs. You can analyze the number of live and failed connections, bytes sent and received, and the connection dependencies of your VMs down to the process level. If malicious connections are detected it will include information about those IP addresses and threat level. The newly released VMBoundPort data set enables analysis of open ports and their connections for security analysis.
To begin analyzing this data, you will need to be on-boarded to Azure Monitor for VMs.
Workbooks
If you would like to start your analysis with a prebuilt, editable report you can try out some of the Workbooks we ship with Azure Monitor for VMs. Once on-boarded you navigate to Azure Monitor and select Virtual Machines (preview) from the insights menu section. From here, you can navigate to the Performance or Map tab to see a link for View Workbook that will open the Workbook gallery which includes the following Workbooks that analyze our network data:
- Connections overview
- Failed connections
- TCP traffic
- Traffic comparison
- Active ports
- Open ports
These editable reports let you analyze your connection data for a single VM, groups of VMs, and virtual machine scale sets.
Log Analytics
If you want to use Log Analytics to analyze the data, you can navigate to Azure Monitor and select Logs to begin querying the data. The logs view will show the name of the workspace that has been selected and the schema within that workspace. Under the ServiceMap data type you will find two tables:
- VMBoundPort
- VMConnection
You can copy and paste the queries below into the Log Analytics query box to run them. Please note, you will need to edit a few of the examples below to provide the name of a computer that you want to query.
Common queries
Review the count of ports open on your VMs, which is useful when assessing which VMs configuration and security vulnerabilities.
VMBoundPort
| where Ip != "127.0.0.1"
| summarize by Computer, Machine, Port, Protocol
| summarize OpenPorts=count() by Computer, Machine
| order by OpenPorts desc
List the bound ports on your VMs, which is useful when assessing which VMs configuration and security vulnerabilities.
VMBoundPort
| distinct Computer, Port, ProcessName
Analyze network activity by port to determine how your application or service is configured.
VMBoundPort
| where Ip != "127.0.0.1"
| summarize BytesSent=sum(BytesSent), BytesReceived=sum(BytesReceived), LinksEstablished=sum(LinksEstablished), LinksTerminated=sum(LinksTerminated), arg_max(TimeGenerated, LinksLive) by Machine, Computer, ProcessName, Ip, Port, IsWildcardBind
| project-away TimeGenerated
| order by Machine, Computer, Port, Ip, ProcessName
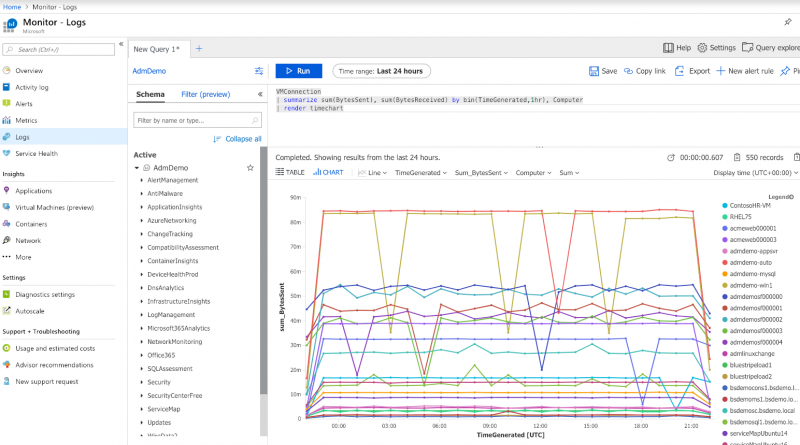
Bytes sent and received trends for your VMs.
VMConnection
| summarize sum(BytesSent), sum(BytesReceived) by bin(TimeGenerated,1hr), Computer
| order by Computer desc
//| limit 5000
| render timechart
If you have a lot of computers in your workspace, you may want to uncomment the limit statement in the example above. You can use the chart tools to view either bytes sent or received, and to filter down to specific computers.
Connection failures over time, to determine if the failure rate is stable or changing.
VMConnection
| where Computer == <replace this with a computer name, e.g. ‘acme-demo’>
| extend bythehour = datetime_part("hour", TimeGenerated)
| project bythehour, LinksFailed
| summarize failCount = count() by bythehour
| sort by bythehour asc
| render timechart
Link status trends, to analyze the behavior and connection status of a machine.
VMConnection
| where Computer == <replace this with a computer name, e.g. ‘acme-demo’>
| summarize  dcount(LinksEstablished), dcount(LinksLive), dcount(LinksFailed), dcount(LinksTerminated) by bin(TimeGenerated, 1h)
| render timechart
Getting started with log queries in Azure Monitor for VMs
To learn more about Azure Monitor for VMs, please read our overview, “What is Azure Monitor for VMs (preview).” If you are already using Azure Monitor for VMs, you can find additional example queries in our documentation for querying data with Log Analytics.
Source: Azure Blog Feed


