Introducing Azure Load Balancer insights using Azure Monitor for Networks
We are excited to announce that Azure Load Balancer customers now have instant access to a packaged solution for health monitoring and configuration analysis. Built as part of Azure Monitor for Networks, customers now have topological maps for all their Load Balancer configurations and health dashboards for their Standard Load Balancers preconfigured with relevant metrics.
Through this, you have a window into the health and configuration of your networks, enabling rapid fault localization and informed design decisions. You can access this through the Insights blade of each Load Balancer resource and Azure Monitor for Networks, a central hub that provides access to health and connectivity monitoring for all your network resources.
Visualize functional dependencies
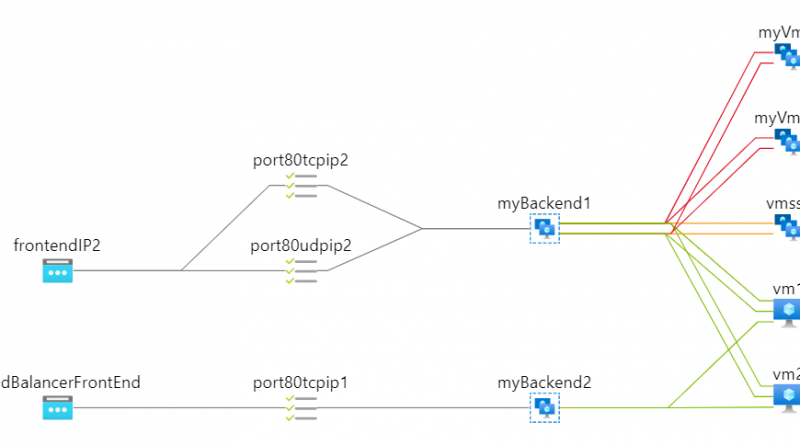
The functional dependency view will enable you to picture even the most complex load balancer setups. With visual feedback on Load Balancing rules, Inbound NAT rules, and backend pool resources, you can make updates while keeping a complete picture of your configuration in mind.
For Standard Load Balancers, your backend pool resources are color-coded with Health Probe status empowering you to visualize the current availability of your network to serve traffic. Alongside the above topology you are presented with a time-wise graph of health status, giving a snapshot view of the health of your application.
Monitor a rich metric dashboard with no setup needed
After reviewing your topology, you may want to dig even further into the data to understand how your Load Balancer is performing through the detailed metrics page. The detailed metrics page is a dashboard preconfigured with separate tabs providing useful insights into Availability, Data Throughput, Flow Distribution, and Connection Latency.
The Overview tab provides a high-level view and from here you can visit the Frontend & Backend Availability or Data Throughput tabs for more in-depth information.
Through the Frontend and Backend availability tabs, you are provided with a breakdown of your Load Balancer and backend pool health status over time. You can consult the Data Throughput tab to learn how much data is parsed through your services by frontend IP, frontend port, and direction.
The Flow Distribution tab provides visualization of load distribution amongst backend resources. This enables you to see the number of flows being created by each backend instance and to keep track of whether you are approaching the limit.
The Connection Monitors tab plots round-trip latencies from Connection Monitors across the globe on a map. With this, you can evaluate the performance impact distances from regions around the world have on your service.
The new monitoring experience is seamless and straightforward to use, with integrated guides and instructions provided as part of each tab.
One place for all your network monitoring needs
Azure Monitor for Networks fully supports the new monitoring and insights experience for Azure Load Balancer. With all your network resource metrics in a single place, you can quickly filter by type, subscription, and keyword to view the health, connectivity, and alert status of all your Azure network resources such as Azure Firewalls, ExpressRoute, and Application Gateways.
As we rapidly transition to the cloud and applications become more complex, customers need tools to easily maintain, monitor, and update their network configurations. With the integration of the Azure Load Balancer with Azure Monitor for Networks, we deliver a piece of this and look forward to continuing to provide our valued customers with the best in class experience they deserve.
Next steps
- Learn more about the Azure Load Balancer, Azure Monitor for Networks, and Network Watcher.
- Deploy your first Load Balancer, customize your metrics, and create a Connection Monitor.
- Give us feedback on this and new features you want to see.
Source: Azure Blog Feed


