Monitoring Azure Arc enabled Kubernetes and servers
Azure Arc is a preview service that enables users to create and attach Kubernetes clusters both inside and outside of Azure. Azure Arc also enables the user to manage Windows and Linux machines outside of Azure the same way native Azure Virtual Machines are managed. To monitor these Azure Arc enabled clusters and servers, you can use Azure Monitor the same way you would use it for the Azure resources.
With Azure Arc, the Kubernetes clusters and servers are given a full-fledged Azure Resource ID and managed identity, enabling various scenarios that simplifies management and monitoring of these resources from a common control plane. For Kubernetes, this enables scenarios such as deploying applications through GitOps-based management, applying Azure policy, or monitoring your containers. For servers, users also benefit from applying Azure policies and collecting logs with Log Analytics agent for virtual machine (VM) monitoring.
Monitoring Azure and on-premises resources with Azure Monitor
As customers begin their transition to the cloud, monitoring on-premises resources alongside their cloud infrastructure can feel disjointed and cumbersome to manage. With Azure Arc enabled Kubernetes and Servers, Azure Monitor can enable you to monitor your full telemetry across your cloud-native and on-premises resources in a single place. This saves the hassle of having to configure and manage multiple different monitoring services and bridges the disconnect that many people experience when working across multiple environments.
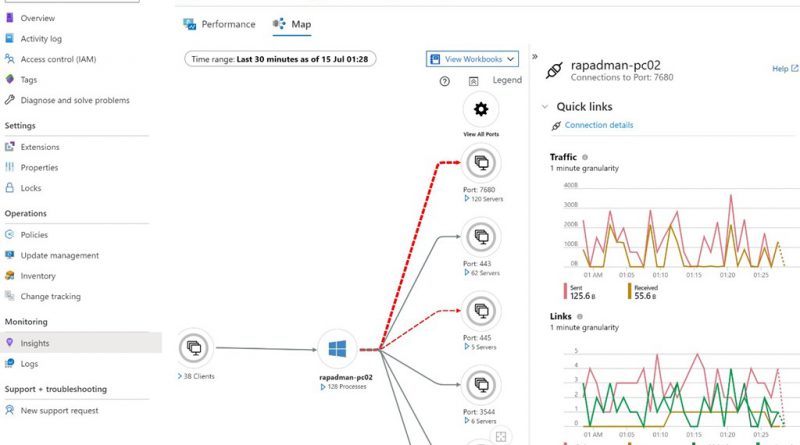
For example, the below view shows the Map experience of Azure Monitor on an Azure Arc enabled server, with the dashed red lines showing failed connections. The graphs on the right side of the map show detailed metrics about the selected connection.
Also, here you can see your data from Azure Kubernetes Services (AKS), Azure Arc, and Azure Red Hat OpenShift side-by-side in Azure Monitor for containers:
Using Azure Monitor for Azure Arc enabled servers
Azure Monitor for VMs is a complete monitoring offering that gives you views and information about the performance of your virtual machines, as well as dependencies your monitored machines may have. It provides an insights view of a single monitored machine, as well as an at-scale view to look at the performance of multiple machines at once.
Azure Arc enabled servers fit right into the existing monitoring view for Azure Virtual Machines, so the monitoring view on an Azure Arc enabled server will look the same as the view of a native Azure Virtual Machines. From within the Azure Arc blade, you can look at your Azure Arc machines and dive into their monitoring, both through the Performance tab, which shows insights about different metrics such as CPU Utilization and the Map tab, which shows dependencies.
In the at-scale monitoring view, your Azure Arc machines are co-mingled with your native Azure Virtual Machines and Virtual Machines Scale Sets to create a single place to view performance information about your machines. The monitoring data shown in these at-scale views will include all VMs, Virtual Machines Scale Sets, and Azure Arc enabled servers that you have onboarded to Azure Monitor.
The Getting Started tab provides an overview of the monitoring status of your machines, broken down by subscription and resource group.
The Performance tab shows trends at scale, as the performance in certain metrics of all the machines in the chosen subscription and resource group. Within the at-scale view, with the provided Type filter, you can drill down any view to show either your native Azure Virtual Machines, native Azure Virtual Machine Scale Sets, or your Azure Arc enabled servers.
You can check out our onboarding documentation to learn how to start monitoring your Azure Arc enabled Servers.
Using Azure Monitor for Azure Arc enabled Kubernetes
Azure Monitor for Containers provides numerous monitoring features to create a thorough experience to understand the health and performance for your Azure Arc clusters.
Azure Monitor provides both an at-scale view for all your clusters, ranging from standard AKS, AKS-engine, Azure Red Hat OpenShift, and Azure Arc. Azure Monitor provides important details, such as:
- Health statuses (healthy, critical, warning, unknown).
- Node count.
- Pod count (user and system).
At the resource level for your Azure Arc enabled Kubernetes, there are several key performance indicators for your cluster. Users can toggle the metrics for these charts based on percentile and pin them to their Azure Dashboards.
In the Nodes, Controllers, and Containers tab, data is displayed across various levels of hierarchy with detailed information in the context blade. By clicking on the View in Analytics, you can take a deep dive into the full container logs to analyze and troubleshoot.
Next steps
There are Azure Monitor Workbooks and Grafana integrations available as well if you want to explore additional metrics or create your own custom monitoring experiences.
You can check out our onboarding documentation to learn how to start monitoring your Azure Arc enabled Kubernetes clusters.
Source: Azure Blog Feed


