Microsoft Clarity is now Generally Available
Microsoft Clarity is a free-to-use analytics product built to help website managers improve their website experiences by better understanding site visitor behavior. With Clarity we’ve built a set of tools that help people who manage websites make more informed decisions about the modifications they should make to their sites. Clarity shows you which parts of your website get the most and least engagement and it provides an invaluable interface for debugging.
Clarity provides you with the tools to make informed decisions about changes to your website using real evidence, and it allows you to do so in a way that helps to respect your users’ privacy and data security. Additionally, building out the kind of system which can provide this evidence on your own can be complex and time consuming.
Designed to Be Easy to Use and to Be Easy on Your Website
Microsoft Clarity is built so that anyone who is trying to improve their website experience can use it. We’ve designed it to be simple to use for developers and non-developers alike. If you want to understand your users without having to analyze the ocean of data that can be derived from operating a website, Clarity is your tool.
Clarity is designed to have a very low impact on page load times, so you can make sure users navigating to your site won’t have to wait for pages to load. Additionally, we don’t place any caps on your traffic so whether you get 10 visitors per day or 1,000,000, Clarity will be able to handle your traffic with no additional cost for you.
Today, Clarity provides several key capabilities including heatmaps and session-replay, as well as an insights dashboard. Let’s take a closer look at each.
See What Clicks with Your Users Using Heatmaps
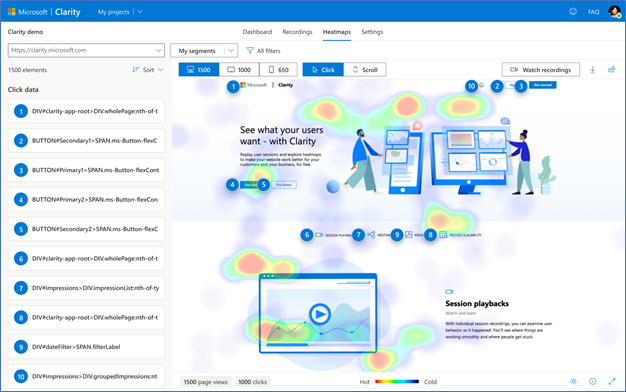
Heatmaps provide a visual way to examine large numbers of user interactions and they come in two forms: clickmaps and scrollmaps. Both of these views pack a whole lot of data into an actionable and easy-to-understand report. Clickmaps tell you what content on your page is important to your users, while scrollmaps show whether your users are seeing what’s important. The aggregate nature of heatmaps help you qualify user behaviors and trends, and they make it easy to communicate impact to stakeholders and provide data-driven justifications for design decisions.

The image above provides an example of one of the kinds of heatmaps we provide for web and mobile: clickmaps. Clickmaps tell you what website page content users are interacting with the most. Areas marked in red have the highest frequency of clicks and are usually centered around focal points. These should align with the portions of your site you want users to click on and, if they don’t, you should consider modifying your page to align them.
Align Your Expectations to Observations with Session Playback
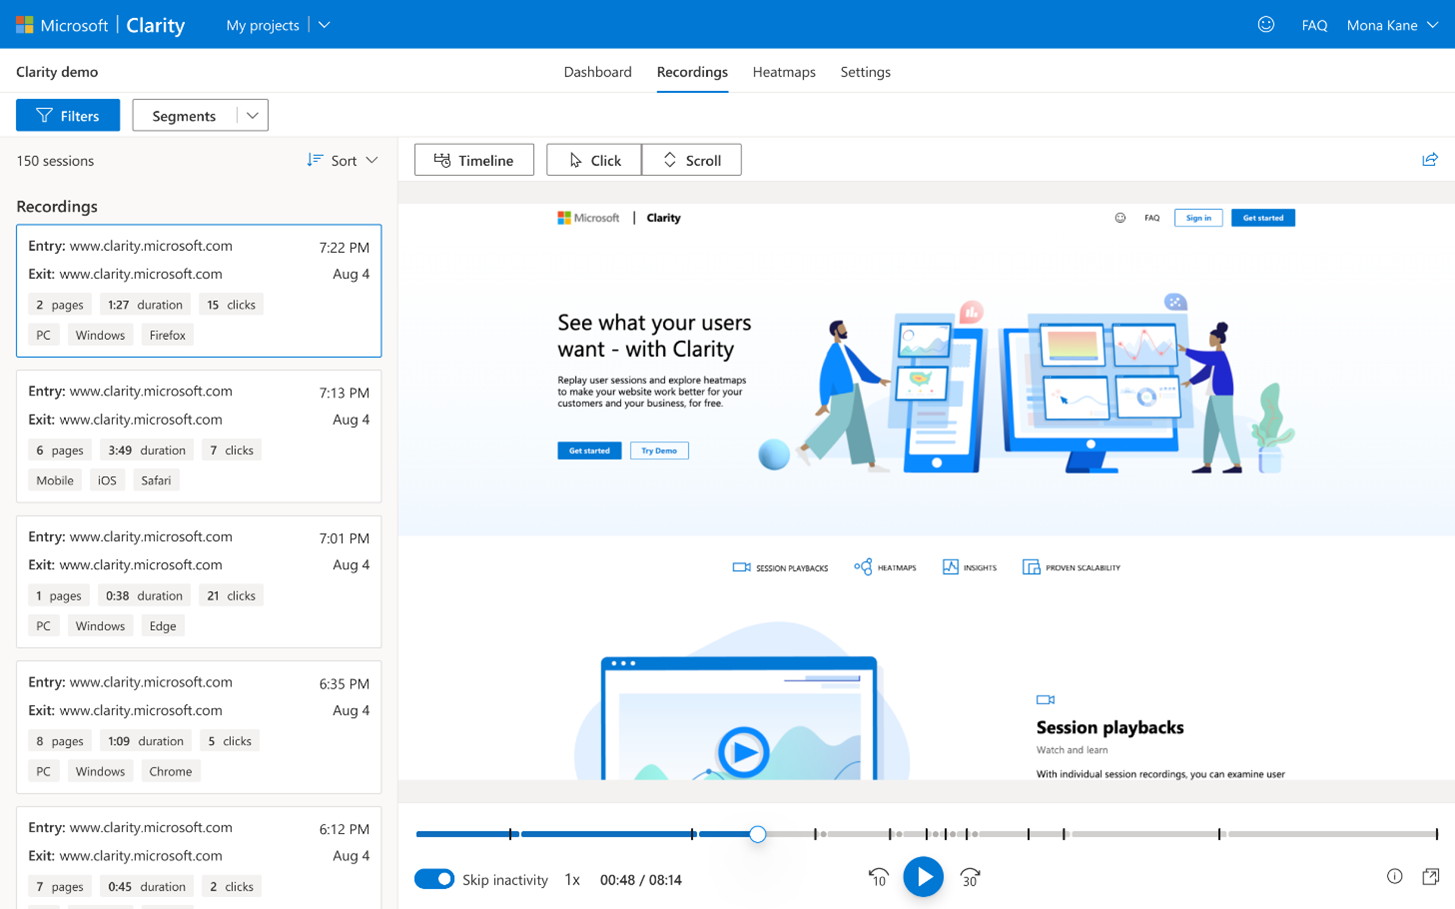
Everyone has an opinion on how people are going to use their website, but Clarity gives you the tools to make data-driven decisions in light of what’s really happening on your site. Root out pesky edge cases and make optimal decisions about new site features.
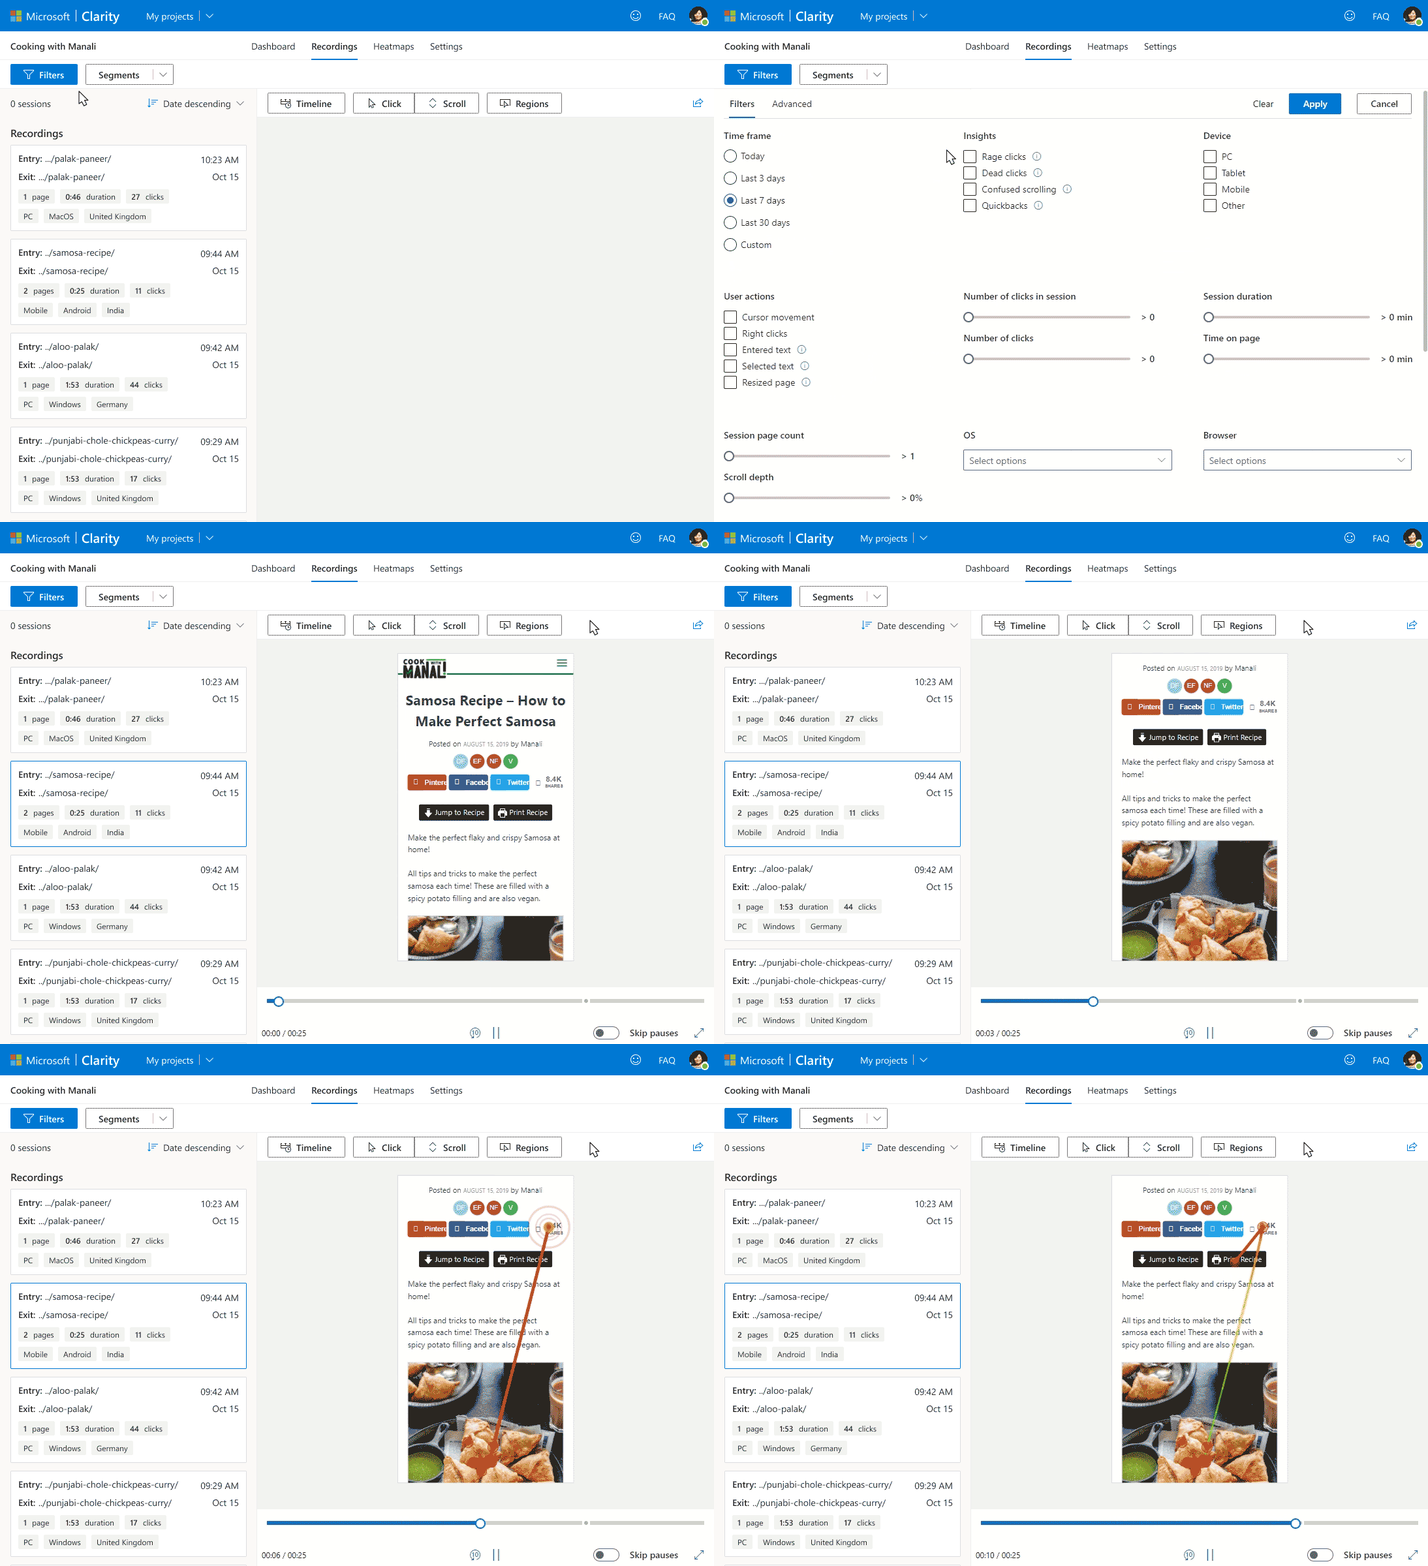
The filtering mechanism you can use to slice recordings allows you to get extremely granular about which recordings to select. We’ve also used machine learning to discover novel patterns in session recordings like “rage clicks,” “dead clicks,” and “excessive scrolling,” and you can use these classifications to filter your sessions as well.
“Rage clicks” are a behavioral pattern where a user clicks several times on a portion of your page that they think should hyperlink somewhere, but which doesn’t. These repeated clicks can be a good indicator of non-intuitive portions of your page or help you identify UI components which aren’t working how they should.
Use the Insights Dashboard to View Your Website Performance
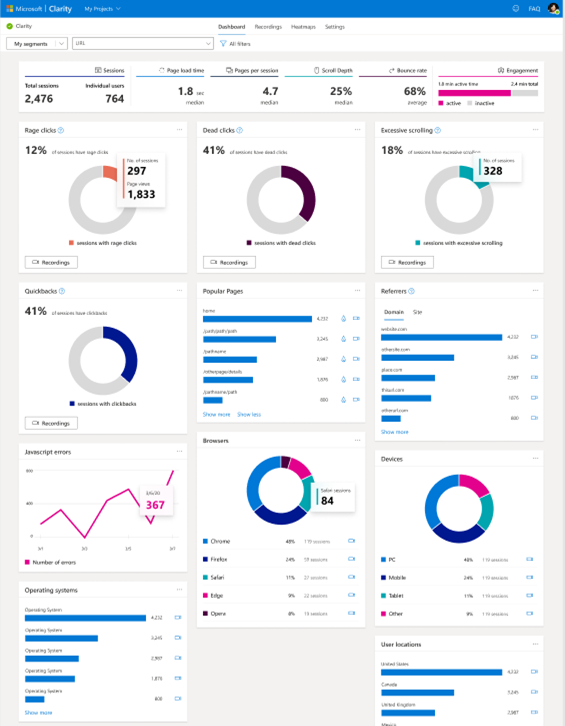
We provide a dashboard of aggregate metrics to help you get an overall understanding of the traffic on your site. At a glance you will be able to see how many users were clicking on non-existent links or how many people scrolled up and down a page in search of something they couldn’t readily find. You can also see things like how many concurrent javascript errors are occurring across your clients or how much time the average user spends navigating your site.
The statistics we provide can be sliced using several of the session filters we provide for recordings, which allow you to drill down on specific patterns of user behavior that can provide the basis for making good decisions about modifying your site.
Sign Up Today for Free
Please visit https://clarity.microsoft.com to try it out for yourself. Sign up is really easy – just create a project, add the Clarity javascript to your site, and you’re ready to go.
We hope this blog post has given you some ideas about how to get the most out of Clarity, and we look forward to hearing your feedback. Just select the Feedback button (  ) in the top-right of any page in the UI.
Thanks,
The Microsoft Clarity team
Source: Bing Blog Feed


