New app usage monitoring capabilities in Application Insights
Our goal with Azure Monitoring tools is to provide full-stack monitoring for your applications. The top of this “stack” isn’t the client-side of your app, it’s your users themselves. Understanding user behavior is critical for making the right changes to your apps to drive the metrics your business cares about.
Recent improvements to the usage analytics tools in Application Insights can help your team better understand overall usage, dive deep into the impact of performance on customer experience, and give more visibility into user flows.
A faster, more insightful experience for Users, Sessions, and Events

Understanding application usage is critical to making smart investments with your development team. An application can be fast, reliable, and highly available, but if it doesn’t have many users, it’s not contributing value to your business.
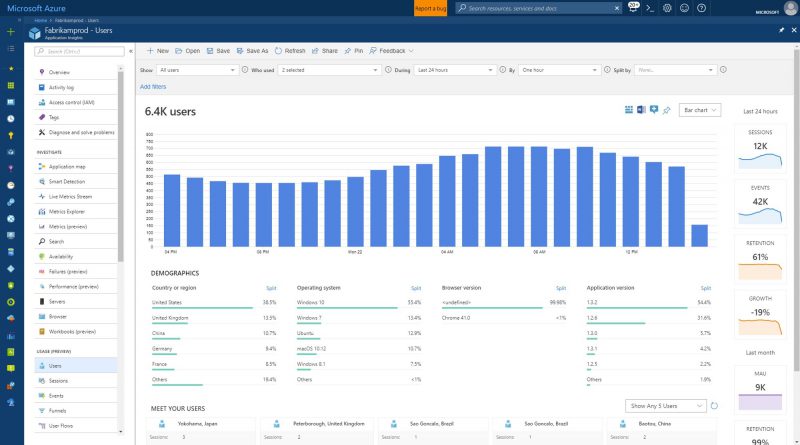
The Users, Sessions, and Events tools in Application Insights make it easy to answer the most basic usage analytics question, “How much does my application and each of its features get used?”
We've re-built the Users, Sessions, and Events tools to make them even more responsive. A new sidebar of daily and monthly usage metrics help you spot growth and retention trends. Clicking on each metric gives you more detail, like a custom workbook for analyzing monthly active users (MAU). Also, the new “Meet your users” cards put you in the shoes of some of your customers, letting you follow their journeys step-by-step in a timeline.
Learn more about Users, Sessions, and Events.
Introducing the Impact tool

Are slow page loads the cause of user engagement problems in your app?
The new Impact tool in Application Insights makes it easy to find out. Just by choosing a page in your app and a user action on that page, the Impact tool graphs conversion rates by page load time. This makes it easy to spot if performance really does cause your users to churn.
The Impact tool can analyze more than just performance impact. It can look for correlations between any property or measurement in your telemetry and conversion rates. So you can see how conversion varies by country, device type, and more.
On our team, the Impact tool has uncovered several places where slow page load time was strongly correlated with decreased conversion rates. Better yet, the Impact tool quantified the page load time we should aim for, the slowest page load time that still had high conversion rates.
Learn more about the Impact tool.
More capabilities for User Flows

Now the User Flows tool can analyze what users did before they visited some page or custom event in your site, in addition to what they did afterward. New “Session Started” nodes show you where a node was the first in a user session so you can spot how users are entering your site.
A new Split By option allows you to create more detailed User Flows visualizations by segmenting nodes by property values. For example, let’s say your team is collecting a custom event name with an overly generic name like “Button Clicked”. You can better understand user behavior by separating out which button was clicked by splitting by a “Button Name” custom dimension. Then in the visualization, you’ll see nodes to the effect of “Button Clicked where Button Name = Save,” “Button Clicked where Button Name = Edit,” and so on.
We’ve made a few smaller improvements to User Flows, too. The visualization now better adapts to smaller screen sizes. A “Tour” button gives you a step-by-step look at how to get more out of the User Flows tool. Also, on-node hide and reveal controls make it easier to control the density of information on the visualization.
Learn more about User Flows.
Source: Azure Blog Feed