Enhancements in Application Insights Profiler and Snapshot Debugger
We are pleased to announce a series of improvements on Application Insights Profiler and Snapshot Debugger. Profiler identifies the line of code that slowed down the web app performance under load. Snapshot Debugger captures runtime exception call stack and local variables to identify the issue in code. To ensure users can easily and conveniently use the tools, we delivered the following new features for Profiler and Snapshot Debugger:
Application Insights enablement with Profiler and Snapshot Debugger
With the newly enhanced Application Insights enablement experience, Profiler and Snapshot Debugger are default options to be turned on with Application Insights.
- Enabling Snapshot Debugger without redeploy your web app: For ASP.NET core web app, snapshot debugger is a simple, default option when enabling App Insights. It used to require modifying the project to install NuGet and add exception tracking code. Now it’s done via an ASP.NET core hosting light up through an App Setting, no redeploy will be required. ASP.NET support will be available very soon.
-
Enabling Profiler with Application Insights in one step: Enabling Profiler used to be done in a separate Profiler Configuration pane, which requires extra steps. This is no longer needed.
Profiler
-
On-demand profiler: Triggering a profiler run session on your web app anytime as needed. Before, Profiler would run randomly 5% of the time, which could miss capturing critical traces. With the new on-demand profiler feature, this problem is solved as users can capture traces anytime as needed.
-
Profiler for ASP.NET core on Linux: Profiler now works on App Services Linux ASP.NET core 2.0 docker images. More platforms will be supported in the future.
Snapshot Debugger
-
Snapshot healthy check: Smartly diagnose why web app runtime exceptions do not have associated snapshot. Easily and quickly troubleshooting snapshot debugger with more insights and visibility.
Enable Profiler and Snapshot Debugger is now easier than ever
We enhanced the App Insights enablement experience for App Services. Suppose you have deployed a Web Application to an App Services resource. Later, you notice your web app is being slow or throwing exceptions. You would want to enable App Insights on your Web App to monitor and diagnose what’s going on. Of course, you don’t want to redeploy the web app just to enable monitoring service.
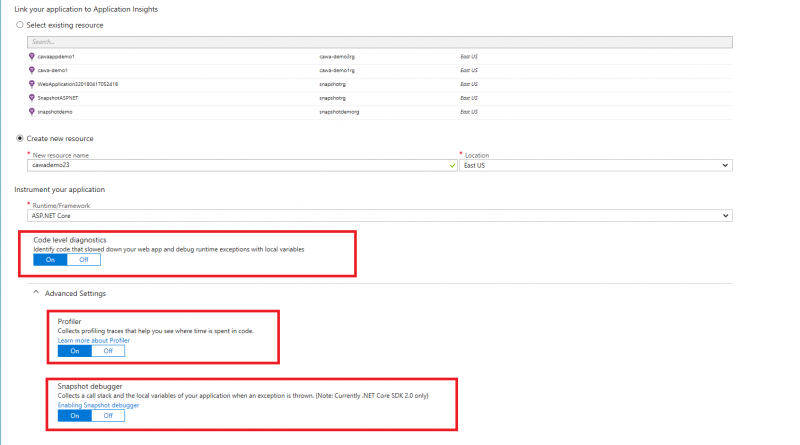
With the new enablement experience, you can easily find the entry point to enable App Insights under Settings | Application Insights. The added section Code level diagnostics is on by default to enable Profiler and Snapshot Debugger for diagnosing slow app performance and runtime exceptions.
Profiler can be enabled easily like this because Profiler agent is installed in the new App Insights site extension and enabled by an App Setting. Snapshot Debugger is enabled through ASP.NET core hosting light up, the runtime will include an assembly if an environment variable is set.
The UI for the new enablement experience allows everything to be configured in one step:

The following App Settings are added to App Services for enabling Profiler and Snapshot Debugger:

Capture Interesting Profiler Traces On-Demand
We are excited to introduce the new on-demand triggering profiler feature. To make sure critical traces are not missed, you can go to the Profiler configuration pane and click on Profile Now button to start the profiler as needed. You can trigger profiler run when you are in the following situations:
-
You want to get started using profiler by capturing the first traces to test everything is working.
-
You want to efficiently and reliably capture traces during a load test run.
-
You need to promptly capture traces for performance issues going on now.
In addition, you get more visibility into how profiler has been running from the Profiler run history list.
You can learn more at Manually trigger Profiler

Investigate performance for ASP.NET Core on Linux using Profiler
Leveraging the Event Pipe technology, we can now capture traces for ASP.NET core web app running inside a Linux container hosted on App Services. The profiler runs in-proc in ASP.NET core to capture traces, which introduces less overhead. The current preview release is for evaluation purposes only. Try it out following Profile ASP.NET Core Azure Linux web apps with Application Insights Profiler.

Snapshot Health Check for Quickly Understand and Solve Issues
To address one of our top customer feedback for sometimes they cannot see snapshots for exceptions, we built a new feature to smartly help users diagnose reasons for missing snapshots. The service does health check on Snapshot Debugger based on user input. When missing snapshot, instead of not showing anything on the End-to-End trace viewer blade, we will show a link to help user troubleshoot what’s going on. We hope this can quickly help our customers to root cause and fix issues. We always strive to enable our customers’ success.
Learn more at troubleshoot snapshot debugger.


Next steps
Enable Profiler and Snapshot Debugger on your web app today! Send feedback at serviceprofilerhelp@microsoft.com or snapshothelp@microsoft.com. You can also directly reply to this post.
Source: Azure Blog Feed