Azure Monitor alerting just got better!
In March 2018, we announced the next generation of alerts in Azure. Since then, we have received overwhelming feedback from you appreciating the new capabilities and providing asks for the next set of enhancements. Today, I am happy to announce exciting new developments in Azure Monitor alerts.
One Alerts experience
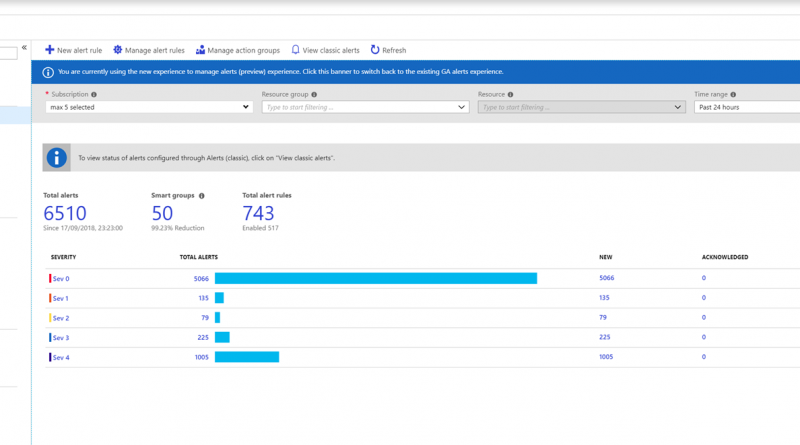
The unified alerts experience in Azure Monitor just got better! We are introducing the unified experience in all major services in Azure, complemented with the One Metrics and One Logs experience to provide you quick access to these capabilities.
As part of the alerts experience, we’re introducing new ways to visualize and manage alerts, providing a bird’s eye view to all alerts across subscriptions by severity, a drill down view into all the alerts and a detailed view to examine each alert. This is complemented by Smart Groups (preview), which automatically consolidates multiple alerts into a single group using advanced AI techniques. Using these capabilities, you can troubleshoot issues in your environment quickly.
Expanded coverage
We are expanding alerting coverage to include more Azure services including web apps, functions and slots, custom metrics, and standard and webtest for Azure Monitor Application Insights.
The alerts experience now also provides a single pane of glass for viewing fired alerts for enumerating across your environment – whether you use Azure Monitor, SCOM, Nagios or Zabbix to manage your environment. This experience is backed by a new unified API for enumerating alerts, which you can use programmatically to integrate against other tools you use.
We’ve also heard from you for the need to monitor for complex conditions across your stack. We are enabling alerts across logs generated by App Insights and Log Analytics. Using this capability, you can create alert rules across logs generated by infrastructure/PaaS services and your app by defining queries that span multiple workspaces or apps or both in the alert rule.
Defining rules at scale
One consistent piece of feedback we’ve received from you is to allow for defining a single alert rule that targets multiple resources. Today, we are introducing multi-resource metric alert rules to allow you to do just that! As part of the rule, you can specify a list of resources, a resource group or a subscription as a target. All of the resources will be individually monitored for the criteria specified in the rule. You can also define an alert rule with “*”, which allows you to auto grow and shrink as resources are added in your environment targeted by the rule. We are currently supporting this capability for Virtual Machines only, but will soon expand this to other resource-types. Watch this space for more!
Alerting on multiple dimensions? We’ve got that covered too! As part of alerting at scale, we are allowing you the ability to define multiple dimensions that should be monitored using a single alert rule. Again, we are supporting * in this scenario too, to cover newly added or removed dimension values in the rule.
Faster log alerts is now Generally Available
As part of today’s announcements, we are also declaring GA of metric alerts for logs. This capability allows you to convert specific log types in log analytics (heartbeat, perf counters, events and update) to metrics and create alert rules on these metrics. This brings down the latency to generate a log alert to under 5 minutes.
Alerting on multiple dimensions is also supported for metric alerts for logs – allowing you to monitor multiple computers in your log analytics workspace in a single alert rule!
The Azure monitor alerts team is excited to bring these new enhancements to you! We would love to hear your feedback as you deploy these capabilities in your environment. You can reach us at azurealertsfeedback@microsoft.com. We look forward to hearing from you.
Source: Azure Blog Feed


