Azure Monitor is providing a unified logs experience
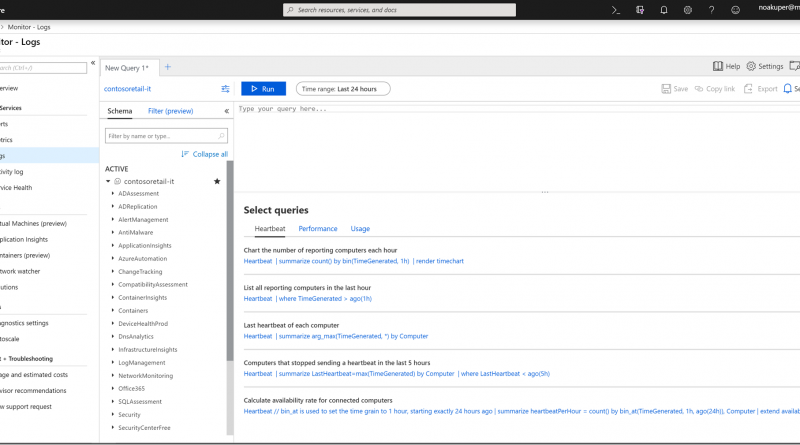
We’re happy to provide a new, unified log search and analytics experience for Azure Monitor logs, as announced earlier this week. Azure Monitor logs is the central analytics platform for monitoring, management, security, application, and all other log types in Azure. The new logs experience, embedded directly in Azure Portal, integrates the capabilities offered so far through different pages and portals. It provides a single place where you can run both basic searches over logged data, as well as advanced queries that provide diagnostics, root-cause analyses or visualizations. Azure Monitor logs is based on the same Log Analytics data and query engine that many of you have already been using.
Another major improvement is the coming integration of the logs experience with Azure resources, starting with Virtual Machines. This means that instead of leaving the VM you work on to launch Azure Monitor, you can access its logs directly through the VM’s monitoring menu, just like you do for alerts and metrics. When opening logs through a specific resource, you are automatically scoped to log records of that resource only (unlike launching logs through Azure Monitor which has the wider scope of the entire selected workspace). We are working across Azure to ensure that this experience is available for every Azure resource. Note that some options like Query Explorer and Alert integration are not yet available through the resource view, and we will be adding them soon.
The new logs experience
The logs experience is designed to help you get the most of your data – starting with a clear view of your logs and running simple searches, all the way to creating customized advanced queries that you can rely on for your production alerting and dashboarding systems.
Find your way around your logs
The amount of log data collected can be enormous. The new experience offers a set of query examples that can help you get started. As results show up, suggested filters would be displayed, created dynamically based on your result set, so you can easily slice-and-dice the data and zoom in on relevant logs.
Write advanced queries
To get the best insights on your data, you may want to write your own queries. To make query editing easier, logs exposes a full schema view of your data (tables, fields and data types), provides syntax highlighting and IntelliSense (language auto-completion), and a query explorer to access your queries, as well as queries provided by Azure to help you get started. If you’re using multiple workspaces, you can use the workspace selector to quickly switch between them, or even query a different workspace in each tab.
Utilize queries in various ways
Once you’ve created a query that provides meaningful data, you may want to keep tracking that over time or react to changes in the query results. To accomplish that, you can create Azure Monitor alerts based on log queries, pin queries to Azure dashboards, export them to power BI or simply share the query link with a colleague.
We invite you to take part and provide your feedback directly to LAUpgradeFeedback@microsoft.com.
Source: Azure Blog Feed

