New metric in Azure Stream Analytics tracks latency of your streaming pipeline
Azure Stream Analytics is a fully managed service for real-time data processing. Stream Analytics jobs read data from input sources like Azure Event Hubs or IoT Hub. They can perform a variety of tasks from simple ETL and archiving to complex event pattern detection and machine learning scoring. Jobs run 24/7 and while Azure Stream Analytics provides 99.9 percent availability SLA, various external issues may impact a streaming pipeline and can have the significant business impact. For this reason, it is important to proactively monitor jobs, quickly identify root causes, and mitigate possible issues. In this blog, we will explain how to leverage the newly introduced output watermark delay to monitor mission-critical streaming jobs.
Challenges affecting streaming pipelines
What are some issues that can occur in your streaming pipeline? Here are a few examples:
- Data stops arriving or arrives with a delay due to network issues that prevent the data from reaching the cloud.
- The volume of incoming data increases significantly and the Stream Analytics job is not scaled appropriately to manage the increase.
- Logical errors are encountered causing failures and preventing the job from making progress.
- Output destination such as SQL or Event Hubs are not scaled properly and are throttling write operations.
Stream Analytics provides a large set of metrics that can be used to detect such conditions as input events per second, output events per second, late events per second, number of runtime errors, and more. The list of existing metrics and instructions on how to use them can be found on our monitoring documentation.
Because some streaming jobs may have complex and unpredictable patterns of incoming data and the output they produce, it can be difficult to monitor such jobs using conventional metrics like input and output events per second. For example, the job may be receiving data only during specific times in the day and only produce an output when some rare condition occurs.
For this reason, we introduced a new metric called output watermark delay. This metric is aimed towards providing a reliable signal of job health which is agnostic to input and output patterns of the job.
So, how does output watermark delay work?
Modern stream processing systems differentiate between event time also referred to as application time, and arrival time.
Event time is the time generated by the producer of the event and typically contained in the event data as one of the columns. Arrival time is the time when the event was received by the event ingestion layer, for example, when the event reaches Event Hubs.
Most applications prefer to use event time as it excludes possible delays associated with transferring and processing of events. In-Stream Analytics, you can use the timestamp by clause to specify what value should be used as event time.
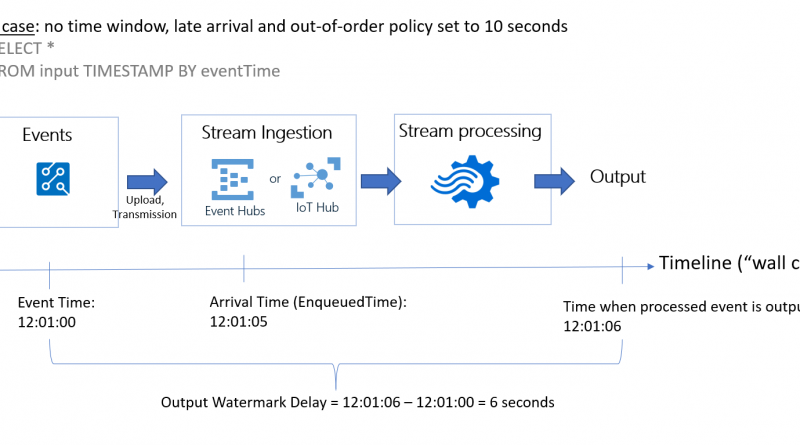
The watermark represents a specific timestamp in the event time timeline. This timestamp is used as a pointer or indicator of progress in the temporal computations. For example, when Stream Analytics reports a certain watermark value at the output, it guarantees that all events prior to this timestamp were already computed. Watermark can be used as an indicator of liveliness for the data produced by the job. If the delay between the current time and watermark is small, it means the job is keeping up with the incoming data and produces results defined by the query on time.
Below we show an illustration of this concept using a simple example of a passthrough query:
Stream Analytics conveniently displays this metric, shown as watermark delay in the metrics view of the job in Azure Portal. This value represents the maximum watermark delay across all partitions of all outputs in the job.

It is highly recommended to set up automated alerts to detect when the watermark delay exceeds expected value. It is recommended to pick threshold value to be greater than late arrival tolerance specified in event ordering settings of the job.
The following screenshot demonstrates the alert configuration in the Azure Portal. You can also use PowerShell or REST APIs to configure alerts programmatically.

Source: Azure Blog Feed

