Understanding health criteria in Azure Monitor for VMs
Azure Monitor for virtual machines (VMs) offers a myriad of monitoring features that help you view VMs from various perspectives. A few of those perspectives are:
- The health of the VM and its components. This helps you to monitor, diagnose, and localize issues in operating systems, core components, and services such as Domain Name System (DNS), Dynamic Host Configuration Protocol (DHCP), and more. Also, it identifies performance issues with CPU, memory, disk, and network adapter on your VMs.
- Performance trends. These trends show you the performance with CPU, memory, disk, and network adapter performance metrics over time.
- Maps – Connection topology and metrics. This gives you a visual map that shows the processes running on your VMs and the interaction between them, as well as important events and alerts.
Azure Monitor for VMs evaluates a various canned set of conditions called health criteria on your VMs in near real-time and triggers an alert if any health criterion goes to critical/warning state (alerts are turned on by default, but you can alter the behavior). For example, if the CPU utilization health criterion is in a critical state, an alert titled “CPU utilization too high” will fire. You can manage the health alerts just like you manage any other alert in Azure Monitor in the Alerts pivot in the portal.
You no longer have to worry about creating alerts for each health criteria. For a full list of each criterion, read the documentation, "Understand the health of your Azure virtual machines with Azure Monitor for VMs (Preview)."

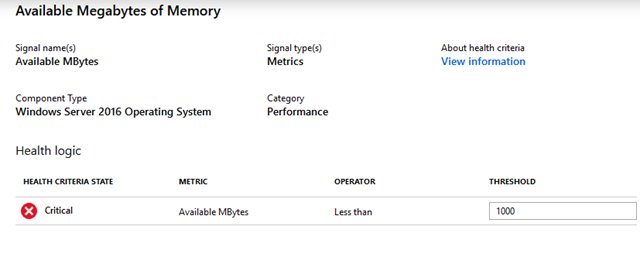
To understand if health criteria fires an alert or not, simply click on the health criteria link from per VM experiences to view its configuration.
Leveraging the APIs
While you can use Azure portal for most of the tasks related to health monitoring for VMs, there are certain properties and configurations that are only accessible through the APIs. In addition, you may want to use APIs to automate some of the tasks. Let’s take a tour of the APIs and see how you can leverage them for specific scenarios.
1. To identify what health criteria are applicable or active on a particular VM, and to get their IDs that are required for other API-related operations, use the following GET API example leveraging ARM client on command prompt shown below.

"subscriptions/Subscription_Name/resourceGroups/Resource_Group_Name/providers/Microsoft.Compute/virtualMachines/VM_Name/providers/Microsoft.WorkloadMonitor/monitors?api-version=2018-08-31-preview”
2. Updates to health states are governed by two additional parameters, frequency and lookback period. Frequency is the rate at which a health criterion is executed, and lookback is the duration over which is a criterion is evaluated. For example, if health criterion is evaluating the condition CPU utilization is greater than 95 percent with frequency of 5 minutes and a lookback duration of 15 minutes. This means that the condition whether CPU utilization is greater than 95 percent is evaluated every 5 minutes, but if it remains greater than 95 percent for 15 minutes (3 consecutive evaluation cycles), then the state will be updated to critical if it wasn’t already.
Currently, frequency and lookback period are not exposed in the UI. However, you can get these values using the API. Shown below is an example leveraging ARM client on command prompt.

"subscriptions/Subscription_Name/resourceGroups/Resource_Group_Name/providers/Microsoft.Compute/virtualMachines/VM_Name/providers/Microsoft.WorkloadMonitor/monitors/Monitor_ID?api-version=2018-08-31-preview”
Note: Modification of frequency and Lookback period isn’t available today.
3. Enabling or disabling an alert on a health criterion. For example, if alerting is enabled on a health criterion and you would like to disable it, the following expression could be used.
armclient patch

“subscriptions/Subscription_Name/resourceGroups/Resource_Group_Name/providers/Microsoft.Compute/virtualMachines/VM_Name/providers/Microsoft.WorkloadMonitor/monitors/Monitor_ID?api-version=2018-08-31-preview 1-preview "{'properties':{'alertGeneration':’Disabled’ }}"
4. Updating the threshold of a Health Criteria.
armclient patch

subscriptions/Subscription_Name/resourceGroups/Resource_Group_Name/providers/Microsoft.Compute/virtualMachines/VM_Name/providers/Microsoft.WorkloadMonitor/monitors/Monitor_ID?api-version=2018-08-31-preview 1-preview "{'properties':{'Threshold':’Desired_Value’ }}"
After making the desired edits you can use the GET API highlighted in point No. 2 above to understand whether the configuration updated. You can even validate it from the portal.
5. To associating Action group(s) with any of a VM’s health criteria.
Create a file titled “file_name” and update its extension to “.json”.
Its contents should look like this:
{

                "ActionGroupResourceIds": [“Action_Group_Resource_ID"]

                }
Use the following PUT API to associate action group to a VM (for health alerts triggered by Azure Monitor for VMs).
armclient PUT

"subscriptions/Subscription_Name/resourceGroups/Resource_Group_Name/providers/Microsoft.Compute/virtualMachines/VM_Name/providers/Microsoft.WorkloadMonitor/notificationSettings?api-version=2018-08-31-preview"  @file_name.json (JSON Script)
To check whether the setting updated correctly, use the following GET API.
armclient GET

"subscriptions/Subscription_Name/resourceGroups/Resource_Group_Name/providers/Microsoft.Compute/virtualMachines/VM_Name/providers/Microsoft.WorkloadMonitor/notificationSettings?api-version=2018-08-31-preview"
To explore the API surface further, look at the swagger published on GitHub.
Source: Azure Blog Feed