Location intelligence for the enterprise: New pricing tier and SDK updates
This blog post was co-authored by Ricky Brundritt, Senior Program Manager, Azure IoT.
Today we are excited to announce multiple new features available designed to support Azure Maps customers. Azure Maps represents a new vision of map services aiding Azure enterprise customers through their digital transformation. Our new pricing tier and SDK updates represent our commitment to deliver scalable, high quality mapping capabilities to the multitude of applications requiring location services across the Azure platform.
New enterprise pricing tier for Azure Maps
Today, we’re announcing the S1 pricing tier. The S1 pricing tier offers enterprise scale and advanced geospatial functionality to support mission-critical applications. In the year since we launched, Azure customers have integrated Azure Maps and its portfolio of world-class location-intelligence services into their applications. As customers move from proof of concept to large-scale deployments, our team has received strong feedback for enterprise-level scale and advanced geospatial functionality.
The S1 pricing tier will complement the existing S0 pricing tier. The S0 tier is designed to meet the needs of small or medium enterprises, customers who do not expect high volumes of concurrent users, or customers whose service requirements are met by the core geospatial APIs. Customers can learn more about how to upgrade their accounts from S0 to S1 accounts in our documentation.
Azure Maps Web SDK Fall 2018 update
Also available now is the Fall 2018 update of the Azure Maps Web SDK and the many great new features and improvements it contains. Some of the key improvements added to this update include:
- New heat map and image overlay layers
- Vector traffic tile integration
- HTML Marker Templates
- NPM Package and Typescript Definitions
- New Night map style
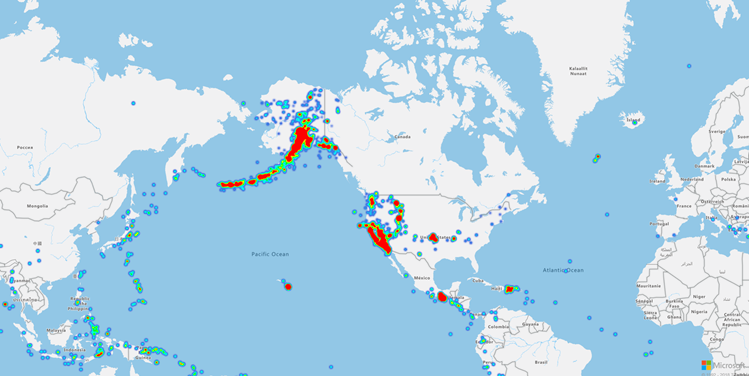
- New Heat map Layer
Heat maps, also known as point density maps, are a type of data visualization used to represent the density of data using a range of colors. They are often used to show the data “hot spots” on a map and are great to help understand data depending on the map scale. For example, a map of insured home property owners submitting a claim may be better understood by visualizing a heat map when looking at national trends, while when focusing on a few neighborhoods it may be useful to look at individual point data.
To render a data source of points as a heat map simply pass your data source into an instance of the HeatMapLayer class and add it to the map as shown here.
var layer = new atlas.layer.HeatMapLayer(datasource);
map.layers.add(layer);

The heat map layer also supports weighted data points which allows even larger data sets to be rendered. When using weighted data points the intensity of an individual data point is rendered based on the weight. For example, if a data point has a weight of 10, it will be rendered as if 10 data points that have a weight of 1 were rendered in the same place.
By enabling clustering on the data source, points that are close to one another are grouped together as a clustered point. By using data-driven styling, the point count of each cluster can be used as the weight for the heat map and significantly reduce the number of points that have to be rendered. The point count of a cluster is stored in a point_count property of the point feature as shown below.
var layer = new atlas.layer.HeatMapLayer(datasource, null, {

    weight: ['get', 'point_count']

});
Tip: If the clustering radius is only a few pixels there will be little visual difference in the rendering. A larger radius will group more points into each cluster and improve the performance of the heatmap, but the differences will be more noticeable.
Here are some additional heat map layer samples:
New image overlay layer
Overlay georeferenced images on top of the map so that they move and scale as you pan and zoom the map. This is great for building floor plans, overlaying old maps, or imagery from a drone. With the new image layer you can easily overlay georeferenced images on the map. To overlay an image on the map, simply pass in a URL and the coordinates for the four corners of the image.
var layer = new atlas.layer.ImageLayer({

    url: '../Common/images/newark_nj_1922.jpg',

    coordinates: [

        [-74.22655, 40.773941], //Top Left Corner

        [-74.12544, 40.773941], //Top Right Corner

        [-74.12544, 40.712216], //Bottom Right Corner

        [-74.22655, 40.712216]  //Bottom Left Corner

    ]

});

If you have georeferenced images stored as a Keyhole Markup Language (KML) ground overlay they can easily be rendered on Azure Maps using an image layer as well. KML ground overlays specify the bounding edges of the image and optionally a counter-clockwise rotation. The ImageLayer has a static function called getCoordinatesFromEdges that can be used to calculate the four corner coordinates of the image, however it accepts a clockwise rotation value. To handle this, simply take 360 and subtract the KML rotation value to get a clockwise rotation value. Here is an example:
var overlayInfo = {

    url: '../Common/images/1600px-Chartres.svg.png',

    north: 48.44820923628113,

    south: 48.44737203258976,

    east: 1.488833825534365,

    west: 1.486788581643038,

    kmlRotation: 46.44067597839695

};

//Calculate the corner coordinates of the ground overlay.

var coords = atlas.layer.ImageLayer.getCoordinatesFromEdges(

    overlayInfo.north, overlayInfo.south, overlayInfo.east, overlayInfo.west,

    //KML rotations are counter-clockwise, subtrack from 360 to make them clockwise.

    360 - overlayInfo.kmlRotation

);


var layer = new atlas.layer.ImageLayer({

    url: overlayInfo.url,

    coordinates: coords

});

Vector traffic tile integration
With this release we have updated the traffic flow overlay in the Web SDK from the static image tiles to the recently released vector traffic tiles. Vector tiles have a smaller file size, thus reducing bandwidth usage and loading faster, they also get rendered in the client browser which provides a richer user experience and more options for styling.

HTML Marker SVG templates
In addition to rendering point data using the Symbol, Bubble, and Heat Map layers, they can also be rendered as HTML elements on the map. The default style of the HtmlMarker class is a scalable vector graphics (SVG) template which has a color and text placeholder. Simply set the color and text properties in the HtmlMarker options. The following code sets the color of the HtmlMarker to dodger blue and sets the text size to “10.”
var marker = new atlas.HtmlMarker({

    color: 'DodgerBlue',

    text: '10',

    position: [0, 0]

});

In addition to being able to set the color and text of the default HtmlMarker style, you can also specify your own template and add placeholders for {color} and {text} as shown below.
var marker = new atlas.HtmlMarker({

    htmlContent: '<svg xmlns="http://www.w3.org/2000/svg" xmlns:xlink="http://www.w3.org/1999/xlink" width="30" height="37" viewBox="0 0 30 37" xml:space="preserve"><rect x="0" y="0" rx="8" ry="8" width="30" height="30" fill="{color}"/><polygon fill="{color}" points="10,29 20,29 15,37 10,29"/><text x="15" y="20" style="font-size:16px;font-family:arial;fill:#ffffff;" text-anchor="middle">{text}</text></svg>',

    color: 'Purple',

    text: '2',

    position: [0, 0]

});

NPM package and TypeScript definitions
Currently you can integrate Azure Maps into your web application by adding a URL to the map script URL and CSS files hosted by the Azure Maps team and write your code using JavaScript. With this release we have created TypeScript definitions which provide intellisense and richer error catching functionality to your development environment. If you haven’t used TypeScript before we highly recommend you give it a try as it fills a lot of gaps that many wished JavaScript supported and makes development easier. In fact, we wrote the Azure Maps Web SDK using TypeScript.
In addition to this we have also combined the TypeScript definitions with a copy of the Azure Maps Web SDK source code and made it available as a NPM package, thus making it easier to integrate with modern web frameworks and providing you the option to host the Azure Maps Web SDK locally with your app for faster loading. You can find Azure-Maps-Control or install it from the command line using the following:
> npm i azure-maps-control
New night map style
With this release we added a new night road map style. It is similar to the grayscale_dark map style but has colorful roads and icons.

We want to hear from you!
We are always working to grow and improve the Azure Maps platform and want to hear from you.
- Have a feature request? Add it or vote up the request on our Feedback site.
- Having an issue getting your code to work? Have a topic you would like us to cover on the Azure Maps blog? Ask us on the Azure Maps forum. We’re here to help and want to make sure you get the most out of the Azure Maps platform.
- Looking for code samples or wrote a great one you want to share? Join us on GitHub.
- For more information, read our Azure Maps documentation.
Source: Azure Blog Feed