Microsoft 365 boosts usage analytics with Azure Cosmos DB – Part 2
This post is part of a 2-part series about how organizations are using Azure Cosmos DB to meet real world needs, and the difference it’s making for them. In part 1, we explored the challenges that led the Microsoft 365 usage analytics team to take action, the architecture of the new solution, and migration of the production workload. In this post, we’ll examine additional implementation details and the outcomes resulting from the team’s efforts.
Finding the right partition key—a critical design decision
After moving to Azure Cosmos DB, the team revisited how data would be partitioned (referred to as “sharding” in MongoDB). With Azure Cosmos DB, each collection must have a partition key, which acts as a logical partition for the data and provides Azure Cosmos DB with a natural boundary for distributing data across partitions. The data for a single logical partition must reside inside a single physical partition. Physical partition management is managed internally by Azure Cosmos DB.
The Microsoft 365 usage analytics team worked closely with the Azure Cosmos DB team to optimize data distribution in a way that would ensure high performance. The team initially tried the same approach as they used with MongoDB, which was using a random GUID as the partition key. However, this required scanning all of the partitions for reads and over allocating resources for writes, making writes fast but reads slow. The team then tried using Tenant ID as the partition key but found that the vast difference in the amount of report data for each tenant made some partitions too hot, which would have required throttling, while others remained cold.
The solution lay in creating a synthetic partition key. In the end, the team solved both the slow read and too hot and too cold issues by grouping 100 documents per tenant ID into a bucket and then using a combination of tenant IDs and bucket IDs as the partition key. The bucket ID loops from 1 to n, where n is a variable and can be adjusted for each report.
Handling four terabytes of new data every day
In one region alone, more than 6 TB of data is stored in Azure Cosmos DB, with 4 TB of that written and refreshed daily. Both of those numbers are continuing to grow. The database consists of more than 50 different collections, and the largest is more than 300 GB in size. It consumes an average of 150,000 request units per second (RU/s) of throughput, scaling this number up and down as needed.
The different collections map closely to the different reports that the system serves, which in turn have different throughput requirements. This design enables the Microsoft 365 usage analytics team to optimize the number of RU/s that are allocated to each collection (and thus to each report), and to elastically scale that throughput up or down on a per-collection and per-report basis.
Built-in, cost-effective scalability and performance
With Azure Cosmos DB, the Microsoft 365 usage analytics team is delivering real-time customer insights with less maintenance, better performance, and improved availability—all at a lower cost. The new usage analytics system can now easily scale to handle future growth in the number of Office 365 commercial customers. All that was accomplished in less than five months, without any service interruptions. “The benefits of moving from MongoDB to Azure Cosmos DB more than justify the effort that it took,” says Guo Chen, Principal Software Development Manager on the Microsoft 365 usage analytics team.
Improved performance and service availability
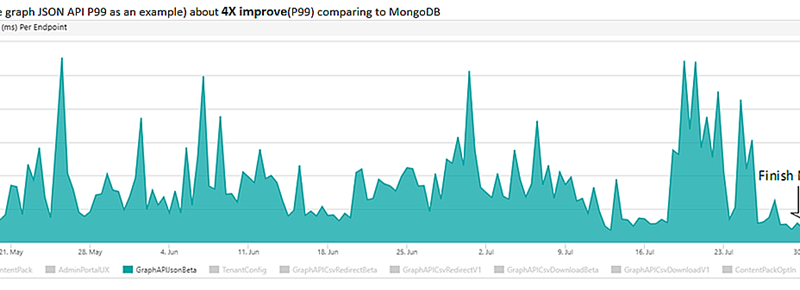
The team’s use of built-in, turnkey geo-distribution provided a way to easily distribute reads and writes across two regions. Combined with the other work done by the team, such as rewriting the data access layer using the Azure Cosmos DB Core (SQL) API, this enabled the team to reduce the time for the majority of reads from 12 milliseconds to 3 milliseconds. The image below illustrates this performance improvement.

Although this difference may seem negligible in the context of viewing a report, it resulted in significant service improvements. “There are two ways to access reporting data in the usage analytics system: through the Microsoft 365 admin center, and through Microsoft Graph,” explains Xiaodong Wang, a Software Engineer on the Microsoft 365 usage analytics team. “In the past, people complained that the Graph API was too slow. That’s no longer an issue. In addition, service availability is better now because the chances of any query timing-out are reduced.”
The image below shows just how much service availability is improved. The graph illustrates successful API requests divided by the total API requests and shows that the system is now delivering a service availability level of greater than 99.99 percent.

Zero maintenance and administration
Because Azure Cosmos DB is a fully managed service, the Office 365 development team no longer needs to devote one full-time person to database maintenance and administration. Annual certificate maintenance is no longer a burden, and VMs no longer need to be restarted weekly to protect against any compromises in service availability.
“In the past, with MongoDB, we had to allocate core developer resources to administrative management of the data store,” says Shilpi Sinha, Principal Program Manager on the Microsoft 365 usage analytics team. “Now that we are running on a fully managed service, we are able to repurpose developer resources towards adding new customer value instead of managing the infrastructure.”
Elastic scalability
The Microsoft 365 usage analytics team can now scale database throughput up or down on demand, as needed to accommodate a fluctuating workload that on average, is growing at a rate of 8 percent every three months. By simply adjusting the number of RU/s allocated to each collection, which can be done in the Azure portal or programmatically, the team can easily scale up during heavy data-ingestion periods to handle new reports, and most importantly, to accommodate continued overall growth of Office 365 around the world.
“Today, all we need to do is keep an eye on request unit usage versus what we have budgeted,” says Wang. “If we’re reaching capacity, we can allocate more RU/s in just a few minutes. We don’t have to pay for spare capacity until we need it and more importantly, we no longer need to worry whether we can handle future growth in data volumes or report usage.”
Lower costs
On top of all of those benefits, the Microsoft 365 usage analytics team increased data and reporting volumes while reducing its monthly Microsoft Azure bill for the usage analytics system by more than 13 percent. “After we cut over to Azure Cosmos DB, our monthly Azure expenses decreased by almost 20 percent,” says Chen. “We undertook this project to better serve our customers. Being able to save close to a quarter-million dollars per year—and likely more in the future—is like icing on the cake.”
“Usage analytics are offered as part of the base capability to all Microsoft 365 customers, irrespective of the type of subscription they purchase," said Sinha. "Keeping the costs of operating this service as low as possible contributes to our goal of running the overall Microsoft 365 service as efficiently as possible while at the same time giving our customers new and improved insights into how their people are using our services.”
Learn more about Microsoft usage analytics and Azure Cosmos DB today.
Source: Azure Blog Feed