Azure Cost Management updates – June 2019
Whether you're a new student, thriving startup, or the largest enterprise, you have financial constraints and you need to know what you're spending, where, and how to plan for the future. Nobody wants a surprise when it comes to the bill, and this is where Azure Cost Management comes in.
We're always looking for ways to learn more about your challenges and how Cost Management can help you better understand where you're accruing costs in the cloud, identify and prevent bad spending patterns, and optimize costs to empower you to do more with less.
Here are the improvements that we'll be looking at today, all based on your feedback:
- Reservation and marketplace purchases for Enterprise Agreements and AWS
- Forecasting your Azure and AWS costs
- Standardizing cost and usage terminology for Enterprise Agreements and Microst Customer Agreements
- Keeping an eye on costs across subscriptions with management group budgets
- Updating your dashboard tiles
- Expanded availability of resource tags in cost reporting
- The new Cost Management YouTube channel
Let's dig into the details.
Reservation and marketplace purchases for Enterprise Agreements and AWS
Effective cost management starts by getting all your costs into a single place with a single taxonomy. Now, with the addition of reservation and marketplace purchases, you have a more complete picture of your Enterprise Agreements (EA) for Azure and AWS costs, and can track large reservation costs back to the teams using the reservation benefit. Breaking reservation purchases down will simplify cost allocation efforts, making it easier than ever to manage internal chargeback.

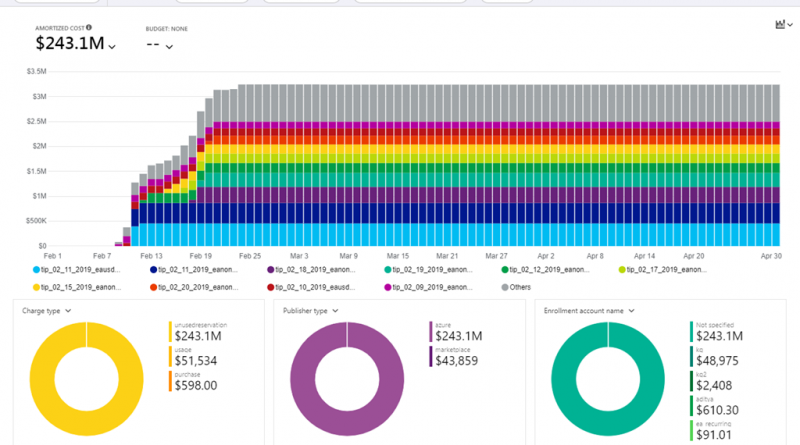
Start by opening cost analysis and changing scope to your EA billing account, AWS consolidated account, or a management group which spans both. You'll notice four new grouping and filtering options to break down and drill into costs:
- Charge type indicates which costs are from usage, purchases, and refunds.
- Publisher type indicates which costs are from Azure, AWS, and marketplace. Marketplace costs include all clouds. Use Provider to distinguish between the total Azure and AWS costs, and first and third-party costs.
- Reservation specifies what the reservation costs are associated with, if applicable.
- Frequency indicates which costs are usage-based, one-time fees, or recurring charges.
By default, cost analysis shows your actual cost as it is on your bill. This is ideal for reconciling your invoice, but results in visible spikes from large purchases. This also means usage against a reservation will show no cost, since it was prepaid, and subscription and resource group readers won't have any visibility into their effective costs. This is where amortization comes in.
Switch to the amortized cost view to break down reservation purchases into daily chunks and spread them over the duration of the reservation term. As an example, instead of seeing a $365 purchase on January , you will see a $1 purchase every day from January 1 to December 31. In addition to basic amortization, these costs are also reallocated and associated with the specific resources which used the reservation. For example, if that $1 daily charge is split between two virtual machines, you'll see two $0.50 charges for the day. If part of the reservation is not utilized for the day, you'll see one $0.50 charge associated with the applicable virtual machine and another $0.50 charge with a new charge type titled UnusedReservation.
As an added bonus subscription, resource group, and AWS linked account readers can also see their effective costs by viewing amortized costs. They won't be able to see the purchases, which are only visible on the billing account, but they can see their discounted cost based on the reservation.
To build a simple chargeback report, switch to amortized cost, select no granularity to view the total costs for the period, group by resource group, and change to table view. Then, download the data to Excel or CSV for offline analysis or to merge with your own data.

If you need to automate getting cost data, you have two options. Use the Query API for rich analysis with dynamic filtering, grouping, and aggregation or use the UsageDetails API for the full, unaggregated cost and usage data. Note UsageDetails is only available for Azure scopes. The general availability (GA) version of these APIs is 2019-01-01, but you'll want to use 2019-04-01-preview to include reservation and Marketplace purchases.
As an example, let's get an aggregated view of amortized costs broken down by charge type, publisher type, resource group—left empty for purchases, and reservation—left empty if not applicable.
POST https://management.azure.com/{scope}/providers/Microsoft.CostManagement/query?api-version=2019-04-01-preview Content-Type: application/json{ "type": "AmortizedCost", "timeframe": "Custom", "timePeriod": { "from": "2019-06-01", "to": "2019-06-30" }, "dataset": { "granularity": "None", "aggregation": { "totalCost": { "name": "PreTaxCost", "function": "Sum" } }, "grouping": [ { "type": "dimension", "name": "ChargeType" }, { "type": "dimension", "name": "PublisherType" }, { "type": "dimension", "name": "Frequency" }, { "type": "dimension", "name": "ResourceGroup" }, { "type": "dimension", "name": "SubscriptionName" }, { "type": "dimension", "name": "SubscriptionId" }, { "type": "dimension", "name": "ReservationName" }, { "type": "dimension", "name": "ReservationId" } ] } }
And if you don't need the aggregation and prefer the full, raw dataset for Azure scopes:
GET https://management.azure.com/{scope}/providers/Microsoft.Consumption/usageDetails?metric=AmortizedCost&$filter=properties/usageStart+ge+'2019-06-01'+AND+properties/usageEnd+le+'2019-06-30'&api-version=2019-04-01-preview
If you need actual costs to show purchases as they are shown on your bill, simply change the type or metric to ActualCost. For more information about these APIs, refer to the Query and UsageDetails API documentation. The published docs show the GA version, but they both work the same for the 2019-04-01-preview API version outside of the new type/metric attribute.
Note that Cost Management APIs work across all scopes above resources. Namely, resource group, subscription, management group via Azure roll-based access control (RBAC) access, EA billing accounts (enrollments), departments, enrollment accounts via EA portal access, AWS consolidated, and linked accounts via Azure RBAC. To learn more about scopes, including how to determine your scope ID or manage access, see our documentation "Understand and work with scopes."
Support for reservation and marketplace purchases is currently available in preview in the Azure portal, but will roll out globally in the coming weeks. In the meantime, please check it out and let us know if you have any feedback.
Forecasting your Azure and AWS costs
History teaches us a lot, and knowing where you've been is critical to understanding where you're going. This is no less true when it comes to managing costs. You may start with historical costs to understand application and organization trends, but to really get into a healthy, optimized state, you need to plan for the future. Now you can with Cost Management forecasts.
Check your forecasted costs in cost analysis to anticipate and visualize cost trends, and proactively take action to avoid budget or credit overages on any scope. From a single application in a resource group, to the entire subscription or billing account, to higher-level management groups spanning both Azure and AWS resources. Learn about connecting your AWS account in last month's wrap up here.

Cost Management forecasts are in preview in the Azure portal, and will roll out globally in the coming weeks. Check it out and let us know what you'd like to see next.
Standardizing cost and usage terminology for Enterprise Agreement and Microsoft Customer Agreement
Depending on whether you use a pay-as-you-go (PAYG), Enterprise Agreement (EA), Cloud Solution Provider (CSP), or Microsoft Customer Agreement (MCA) account, you may be used to a different terminology. These differences are minor and won't impact your ability to understand and break down your bills, but they do introduce a challenge as your organization grows and needs a more holistic cost management solution, spanning multiple account types. With the addition of AWS and eventual migration of PAYG, EA, and CSP accounts into MCA, this becomes even more important. In an effort to streamline the transition to MCA at your next EA renewal, Cost Management now uses new column or property names to align to MCA terminology. Here are the primary differences you can expect to see for EA accounts:
- EnrollmentNumber → BillingAccountId/BillingProfileId
- EA enrollments are represented as "billing accounts" within the Azure portal today, and they will continue to be mapped to a BillingAccountId within the cost and usage data. No change there. MCA also introduces the ability to create multiple invoices within a billing account. The configuration of these invoices is called a "billing profile". Since EA can only have a single invoice, the enrollment effectively maps to a billing profile. In line with that conceptual model, the enrollment number will be available as both a BillingAccountId and BillingProfileId.
- DepartmentName → InvoiceSectionName
- MCA has a concept similar to EA departments, which allows you to group subscriptions within the invoice. These are called "invoice sections" and are nested under a billing profile. While the EA invoice isn't changing as part of this effort, EA departments will be shown as InvoiceSectionName within the cost data for consistency.
- ProductOrderName (new)
- New property to identify the larger product the charge applies to, like the Azure subscription offer.
- PublisherName (new)
- New property to indicate the publisher of the offering.
- ServiceFamily (new)
- New property to group related meter categories.
Organizations looking to renew their EA enrollment into a new MCA should strongly consider moving from the key-based EA APIs (such as consumption.azure.com) to the latest UsageDetails API (version 2019-04-01-preview) based on these new properties to minimize future migration work. The key-based APIs are not supported for MCA billing accounts.
To learn more about the new terminology, see our documentation "Understand the terms in your Azure usage and charges file."
Keeping an eye on costs across subscriptions with management group budgets
Every organization has a bottom line. Cost Management budgets help you make sure you don't hit yours. And now, you can create budgets that span both Azure and AWS resources using management groups.

Organize subscriptions into management groups, and use filters to perfectly tune the budget that's right for your teams.
To learn more, see our tutorial "Create and manage budgets."
Updating your dashboard tiles
You already know you can pin customized views of cost analysis to the dashboard.

You may have noticed these tiles were locked to the specific date range you selected when pinning it. For instance, if you chose to view this month's costs in January, the tile would always show January, even in February, March, and so on. This is no longer the case.
Cost analysis tiles now maintain the built-in range you selected in the date picker. If you pin "this month," you'll always get the current calendar month. If you pin "last 7 days," you'll get a rolling view of the last 7 days. If you select a custom date range, however, the tile will always show that specific date range.
To get the updated behavior, please update your pinned tiles. Simply click the chart on the tile to open cost analysis, select the desired date range, and pin it back to the dashboard. Your new tile will always keep the exact view you selected.
What else would help you build out your cost dashboard? Do you need other date ranges? Let us know.
Expanded availability of resource tags in cost reporting
Tagging is the best way to organize and categorize your resources outside of the built-in management group, subscription, and resource group hierarchy, allowing you to add your own metadata and build custom reports using cost analysis. While most Azure resources support tags, some resource types do not. Here are the latest resource types which now support tags:
- App Service environments
- Data Factory services
- Event Hub namespaces
- Load balancers
- Service Bus namespaces
Remember tags are a part of every usage record and are only available in Cost Management reporting after the tag is applied. Historical costs are not tagged, so update your resources today for the best cost reporting.
The new Cost Management YouTube channel
Last month, we talked about eight new quickstart videos to get you up and running with Cost Management quickly. Subscribe to the new Azure Cost Management YouTube channel to stay in the loop with new videos as they're released. Here's the newest video in our cost optimization collection:
Let us know what other topics you'd like to see covered.
What's next?
These are just a few of the big updates from the last month. We're always listening and making constant improvements based on your feedback, so please keep the feedback coming!
Follow @AzureCostMgmt on Twitter and subscribe to the YouTube channel for updates, tips, and tricks. And, as always, share your ideas and vote up others in the Cost Management feedback forum.
Source: Azure Blog Feed