Microsoft 365 boosts usage analytics with Azure Cosmos DB
This post is part of a 2-part series about how organizations are using Azure Cosmos DB to meet real-world needs, and the difference it’s making for them. In this first post we explore the challenges that led the Microsoft 365 usage analytics team to take action, the architecture of the new solution, and migration of the production workload. In part 2, we’ll examine additional implementation details and the outcomes resulting from the team’s efforts.
The challenge: Understanding the behavior of more than 150 million active users
Office 365 is a flagship service within the Microsoft 365 Enterprise solution, with millions of commercial customers and more than 150 million active commercial users each month. Office 365 provides extensive reporting for administrators within each company on how the service is being used including license assignment, product-level usage, user-level activity, site activity, group activity, storage consumption, and more. The Microsoft 365 usage analytics team incrementally adds new reports to cover more Office 365 services.
Previous architecture
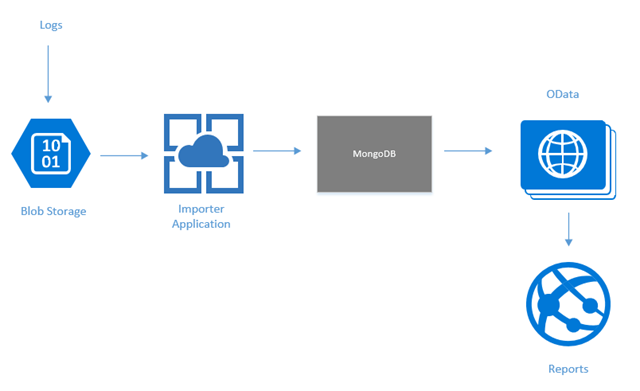
The telemetry data needed to generate such reports was collected in a system called usage analytics, that until recently ran on the community version of MongoDB. The image below shows the data flow, with an importer web service used to write log streams collected in Azure Blob storage to MongoDB. An OData web service exposes APIs to extract the stored data for both reporting within the Microsoft 365 admin center and for access through Microsoft Graph. Every day, as part of a full daily refresh, several billion rows of data were added to the system.

Each of the primary geographies served by Office 365 has an independent usage analytics repository, all employing a similar architecture. In each geography, data was stored on two MongoDB clusters, with each cluster consisting of up to 50 virtual machines (VMs) hosted in Azure Virtual Machines and running MongoDB. The two clusters in each geography functioned in a primary/backup configuration. Data was written separately to both clusters and under normal operation, all reads were performed on the primary cluster.
Each cluster was designed for a write-heavy workload. To speed writes, sharding of data across individual cluster nodes was done using a random globally unique identifier (GUID) such as a MongoDB shard key. Every day for a few hours, new data from Azure Blob storage was written using a multithreaded importer. Each thread wrote batches of 2,000 records at a time to all cluster nodes and waited for all records to finish before starting on the next batch of 2,000.
Problems and pains
This architecture presented several problems for the Microsoft 365 usage analytics team, ranging from excessive administrative effort and costs to limited performance, reliability, availability, and scalability. Some specific pains included:
- Poor performance. Reads were inefficient and reports sometimes timed out because of the use of a random GUID as a shard key required querying all nodes. In addition, during the few hours each day when new data was imported, with writes and reads hitting the primary cluster node during the same time, performance was poor. To make matters worse, if anything failed during a batch write, which often happened due to internal database errors, all 2,000 records had to be written again.
- Full-time administration. Maintenance of the MongoDB clusters was manual and time-consuming, requiring human resources to dedicate time towards managing the clusters. This put an unnecessary resource constraint on the team, which would rather use its bandwidth to bring new reports to market. Plus, bugs in MongoDB 3.2 required all servers to be restarted weekly. And renewing the security certificates on each cluster node within the virtual network had to be completed annually, and required an additional two weeks of effort per cluster. During such routine administrative tasks, if an operation failed on one cluster node, the entire cluster was down until the issue was resolved.
- High costs. Significant costs were incurred to run the MongoDB backup clusters, which remained idle most of the time. Those costs continued to increase as Office 365 usage grew.
- Limited scalability. Less than three years after MongoDB was initially deployed, the largest repository was almost at maximum capacity. Any spare capacity was forecast to run out within six months as more products and reports were added, with no easy way to scale.
While the team was dealing with the architectural limitations of its existing solution, they were looking ahead to a lineup of new, high-scale capabilities that they wanted to enable for customers in the usage analytics space. The team started looking for a new, cost-effective, and low-maintenance solution that would let them move from self-maintained VMs running MongoDB to a fully managed database service.
Geo-distribution on Azure Cosmos DB: The key to an improved architecture
After exploring their options, the team decided to replace MongoDB with Azure Cosmos DB, a fully managed globally-distributed, multi-model database service designed for global distribution and virtually unlimited elastic scalability. The first step was to deploy the needed infrastructure.
In contrast to the primary/backup, two-cluster configuration that it had used with MongoDB, the team took advantage of turnkey global distribution of active data in Azure Cosmos DB. Using multiple Azure regions for data replication provided an easy way to write to any region, read from any region, and better balance the workload across the database instances—all while relying on Azure Cosmos DB to transparently handle active data replication and data consistency.
“True geo-replication had been deemed too hard to do with MongoDB, which is why the previous architecture separately wrote data to both the primary and backup clusters,” says Xiaodong Wang, a Software Engineer on the Microsoft 365 usage analytics team. “With Azure Cosmos DB, implementing transparent geo-distribution literally took minutes—just a few mouse clicks.”
The image below shows the internal architecture of the usage analytics system today. Each of the primary geographies served by Office 365 is served by Cosmos databases geo-replicated across two Azure regions within that geography. Under normal operating conditions, writes are sent to one region within each geography while reads are routed to both. If for some reason a region is prevented from serving reads, those reads are automatically routed to the other region serving that same geography.

Migrating a production workload to Azure Cosmos DB
Developers began writing a new data access layer on the new infrastructure to accommodate reads and writes, using the Azure Cosmos DB SQL (Core) API. After bringing the new system online, the team began to write new production data to both old and new systems, while continuing to serve production reports from the old one.
Developers began to address the reports that they would need to duplicate for the new solution, working through them one at a time. Separate Cosmos containers were created within the database for most reports, so that each collection would be separately scalable after the system came online. The largest reports were addressed first to ensure that Azure Cosmos DB could handle them, and after each new report was verified, the team began serving it from the new environment.
After all functionality and reports were being served by Azure Cosmos DB, and everything was running as it should, the team stopped writing new data to the old system and decommissioned the MongoDB environment. The development team was able to move to Azure Cosmos DB, rewrite the data access layer, and migrate all reports for all geographies without any service interruptions to end users.
In part 2 of this series, we'll cover additional implementation details and the outcomes resulting from the Microsoft 365 usage analytics team’s implementation of Azure Cosmos DB.
Source: Azure Blog Feed